


-
Rapid near surface temperature change in Michael
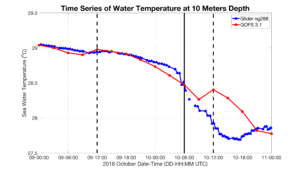
Posted on October 18th, 2018 No commentsHere is a comparison of the temperature in the upper mixed layer (10 m depth and 20 m depth) at the location of Navy Glider 288. Hurricane Michael passed within less than 50 km of ng288. The swath of tropical wind scale winds was about 500 km wide, so this was relatively close to the track of the hurricane. And the glider was on the right had side of the track, so perfectly placed in the most intense winds.
Solid black vertical line is time of hurricane eye passage over Navy Glider 288. Dashed black vertical lines are data assimilation times.
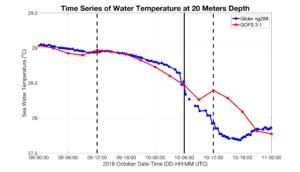
The agreement between the surface layer temperature observed by ng288 and the GOFS 3.1 forecast is remarkable. The model even appears to be cooling the surface layer at the proper rate. Note that most of the observed cooling occurs after eye passage, the opposite of what we see in the Mid Atlantic.
The dashed line at 1200 on Oct 10 will be an interesting case to study with our colleagues. We assume the glider data is being assimilated, our friends at NRL are good at checking for this. During this time of rapid temperature change, if glider data from earlier in the day is assumed to apply at noon on Oct 10, it will try to increase the temperature as we observe here. The model then appears to cool the temperature at the right rate despite being incorrectly offset boy about 0.5C.
Establishing what happened through the data assimilation during the passage of Michael over ng288 will be a great research question for us to prusue over the winter as we prepare for the 2019 hurricane season.
Last 5 posts by Scott Glenn
- Early Season in the Mid Atlantic - June 17th, 2021
- Disturbance in the Gulf - June 16th, 2021
- Hurricane Gliders 2021 - May 3rd, 2021
- Hurricane Iota - November 16th, 2020
- Hurricane Eta - Low Wind Shear, High SST - November 2nd, 2020
