


-
Hurricane Michael glider model comparisons for October 9th
Posted on October 10th, 2018 No comments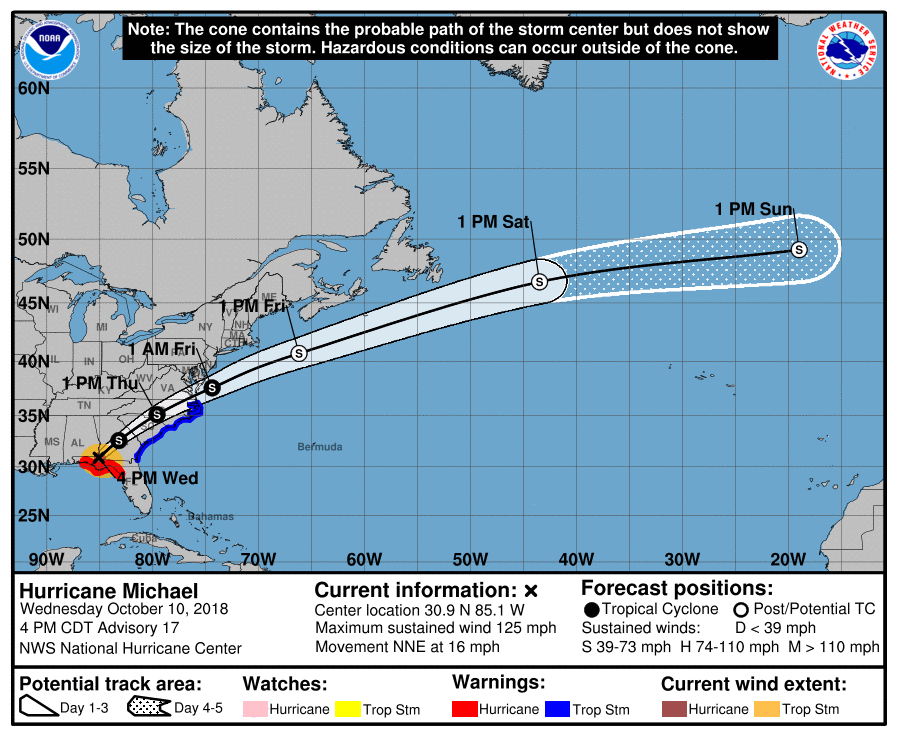
According to the National Hurricane Center Michael has made landfall in Florida as a Category 4 Hurricane with winds just below Category 5 levels.
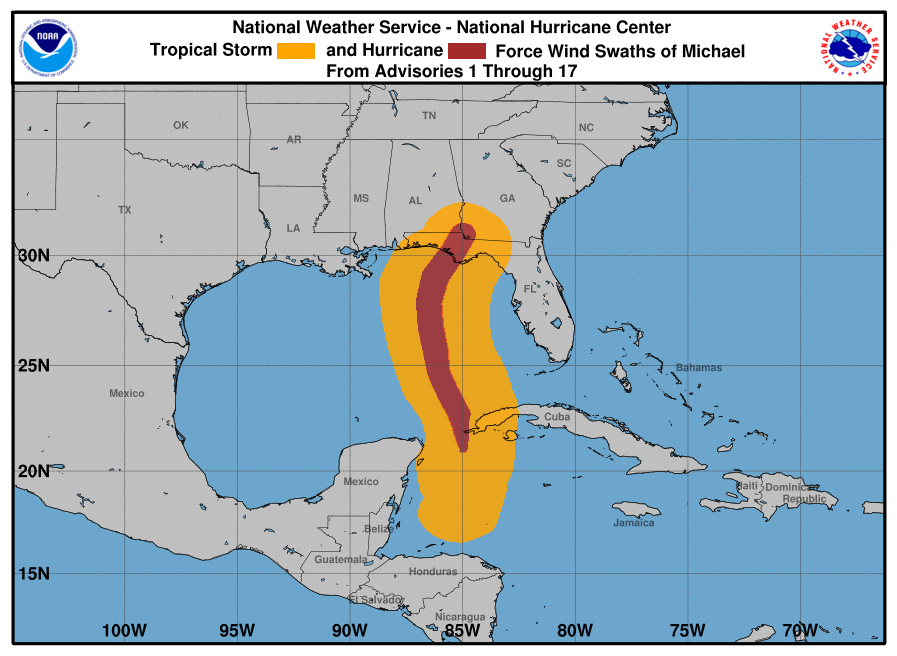
There’s an approximately 500 km wide swath of hurricane and tropical storm force winds across the eastern Gulf of Mexico.
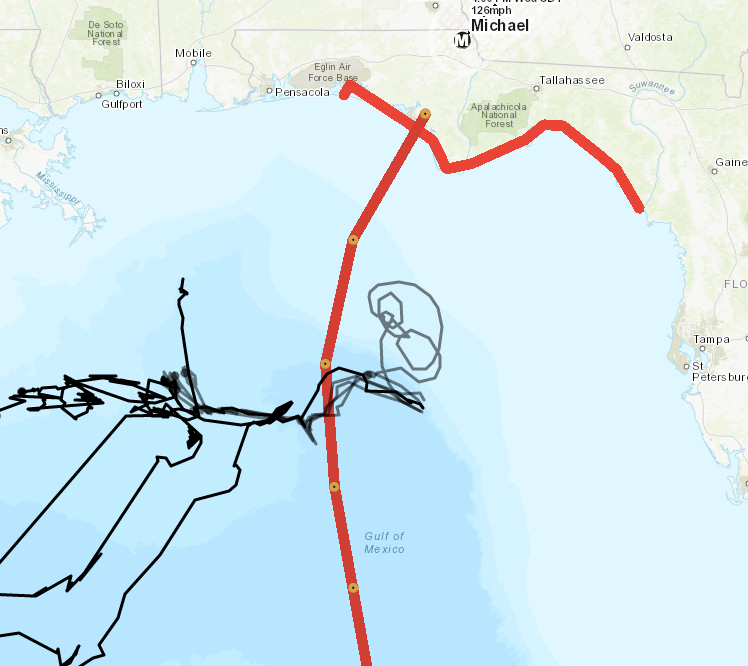
Just prior to landfall, the storm’s eye passed within about 50 kilometers of Navy Glider NG288’s most recent reported location.
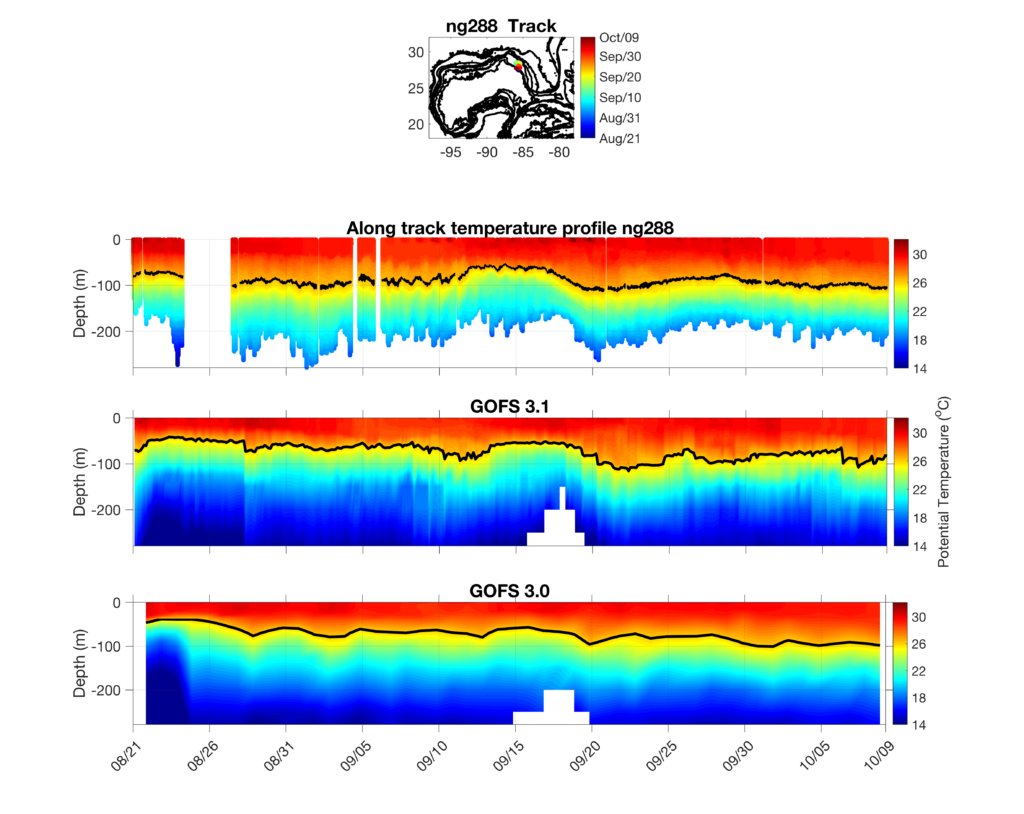
Above are Cross-sections of temperature from (top) Glider NG288, (middle) the Navy HYCOM Global Ocean Forecasting System 3.1, and (bottom) Navy HYCOM Global Ocean Forecasting System 3.0 run by the Navy Research Laboratory. The black contour shows the position of the 26 degrees Celsius isotherm, which is commonly used to calculate ocean heat content for hurricane intensity purposes.
At a glance the models have similar surface temperatures to the glider observations throughout the deployment, but the 26 degree Celsius isotherm in both GOFS 3.0 and 3.1 appear to be slightly shallower than the observed position.
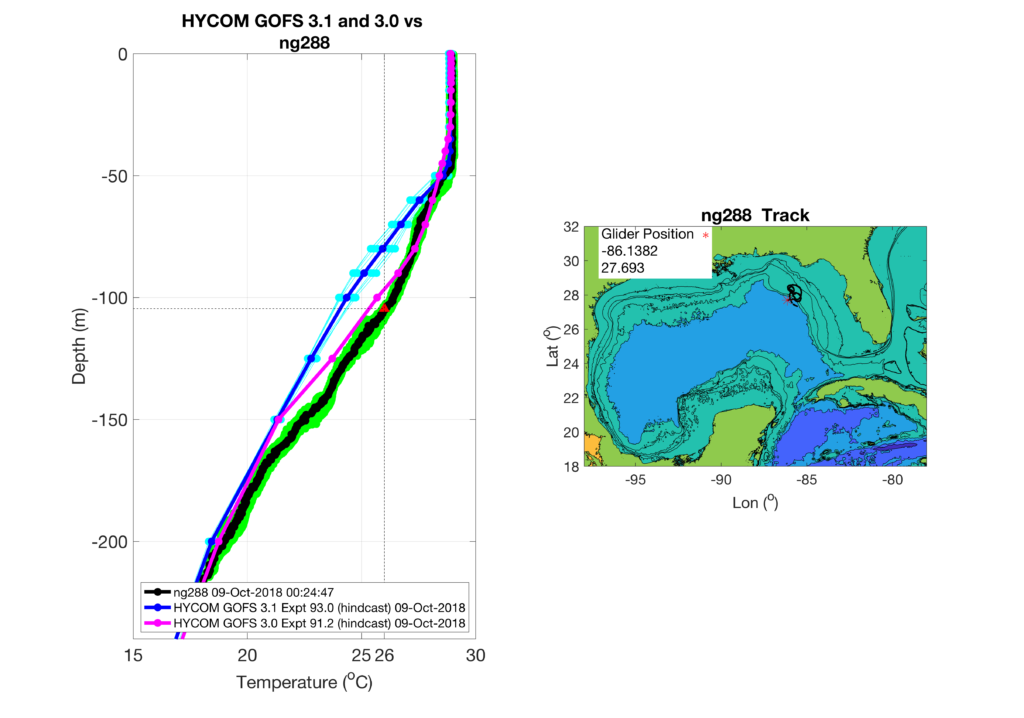
Next we zoom in to the last days profile comparisons before Michaels passage. The lines and colors are defined as in the previous post, but now we’ve added a vertical line and red triangle indicating the 26 degree Celisus temperature its depth in the glider observations. The depth of the mixed layer at 50 meters is well represented by GOFS 3.1, while GOFS 3.0 does a better job of matching the observed temperature profiles below the mixed layer.
Last 5 posts by Travis Miles
- Sally Approaching SG601 - September 13th, 2020
- Coupled Modeling of Fay - July 12th, 2020
- Michael Gulf of Mexico SST anomaly and ocean response - October 11th, 2018
- Navy Glider Model Comparisons for Hurricane Michael - October 8th, 2018
- Isothermal shelf waters and Florence - September 14th, 2018
