


-
Navy Glider Temperature and Salinity Profiles during eye passage.
Posted on October 11th, 2018 No commentsIn the previous post, Travis showed the plot of the CTD temperature section from the Navy glider operating just to the right of the path of Hurricane Michael. Here is our first look at the actual Temperature and Salinity profiles that go into that section plot.
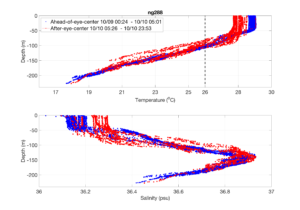
Above we see Maria’s plot of the temperature (top) and salinity (bottom) profiles reported by the Navy glider during the eye passage. Blue is ahead of eye center, red is after eye center. During this time we see a rapid temperature drop of about 1 C, and a deepening of the surface layer from about 50 m to about 90 m. For salinity, we see the salinity of the surface layer increase by about 0.1 psu.
-
Michael Gulf of Mexico SST anomaly and ocean response
Posted on October 11th, 2018 No comments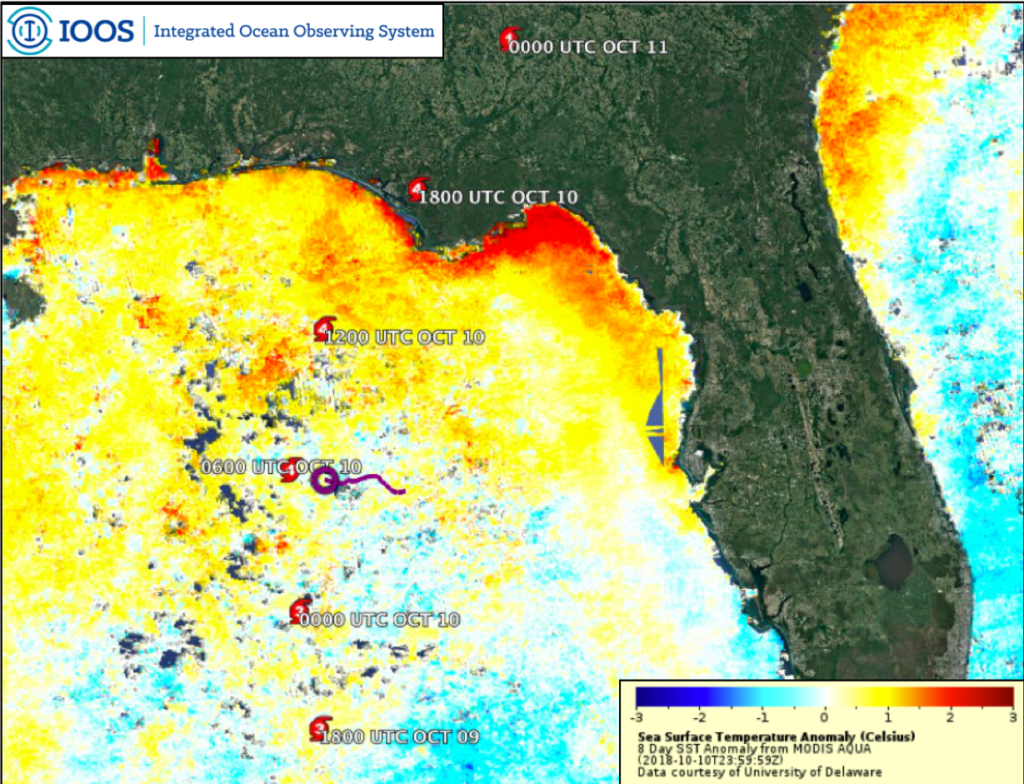
Micahel is now making its way through the Carolinas and into the Northeastern part of the country. It looks like it had a truly devastating impact of the Florida panhandle region coming ashore as a category 4, a few miles per hour shy of a category 5. Some of the rapid intensification is likely due to warm sea surface temperatures in the Gulf of Mexico. Above is a plot of the 8-day composite sea surface temperature anomaly after removal of the 15 year average for the same time period. This product is generated by the University of Delaware Ocean Remote sensing and Biogeography (ORB) Lab. Above average temperatures are clearly visible in the northern portion of the Gulf where the storm intensified.
Additionally, this image shows a glider track in purple for the US Navy Glider NG288, which we’ve been following for the past few blog posts. The system collected data throughout the storm, transmitted it to shore where the Navy made it available to IOOS for public release.
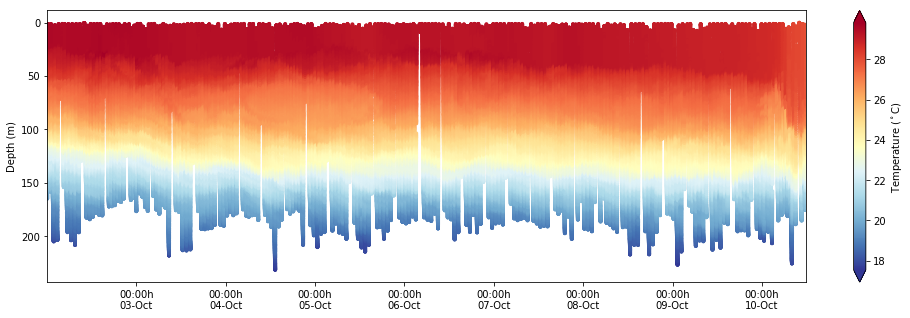
In the time and depth slice from NG288 it’s clear that surface layer was very warm, exceeding 28 Celsius down to about 50 meters ahead of the storm.This thick warm surface layer provided an ample pool of heat to maintain and intensify Michael as it approached land. On October 10th, as the storm passed over the glider location there is rapid mixing and deepening of the surface mixed layer from 50 meters down to almost 100 meters, but with very limited ocean cooling. This is an exciting dataset that we’ll be using for years to come to understand rapid intensification of hurricanes in the Gulf of Mexico.
-
Back to Sri Lanka
Posted on October 11th, 2018 No comments
Waypoint is to the southwest, but RU29 is moving northeast, about 180 degrees from the waypoint. Ru29 is about 140 nautical miles south of Galle, the southern most port and the location of our recovery vessel. the red semi-circle is the 120 nautical mile circle from Galle. At 10 knots, this is a 12 hour boat ride from Galle.
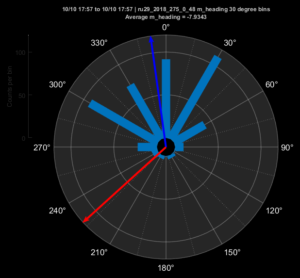
Heading compass rose. Direction to waypoint is in red, to southwest. Histogram of observed heading in 30 degree increments in light blue. Average heading is dark blue arrow, which is almost directly north, or 135 degrees to the right of the commanded heading. But we are not heading north. We are heading northeast. There must be some eastward current.
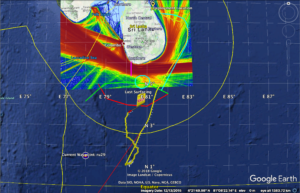
Checking traffic, the busy shipping lane extends around the southern side of Sri Lanka a distance of 40 nautical miles offshore. We don’t want to come any closer than this.
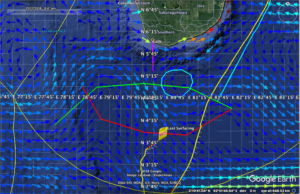
Now we zoom in and look at the currents. First Copernicus. Currents at the glider are to the southeast, so they have an eastward component. Between RU29 and Galle there is a wavy current that runs west to east. There is a low velocity region half way between Ru29 and Sri Lanka circled in cyan. The currents are counterclockwise around this low current region. So a counterclockwise eddy in Copernicus.
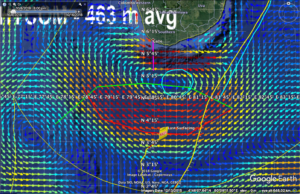
Hycom has an eddy in the exact same place as Copernicus, as seen by the cyan circle. But the circulation around the eddy in hycom is clockwise. The currents at the glider are strong and to the northwest. But the glider needs a current with an eastward component to produce the observed progress to northeast.
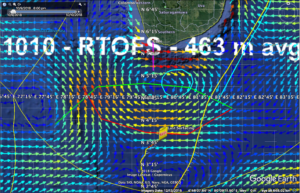
RTOFS has similar results to hycom, with a clockwise eddy between RU29 and Sri Lanka, and strong currents to northwest at the glider.
Looks like the Copernicus model wins today in this location. That means we should move the waypoint to direct our commanded heading to be more towards the south. A waypoint to the south would give us an actual glider flight direction 135 degrees to the right, or towards the northwest. Combine this with the eastward or southeastward currents, and we may get the east-west components to cancel each other, enabling us to make more progress directly to the north.
