


-
Navy Glider Temperature and Salinity Profiles during eye passage.
Posted on October 11th, 2018 No commentsIn the previous post, Travis showed the plot of the CTD temperature section from the Navy glider operating just to the right of the path of Hurricane Michael. Here is our first look at the actual Temperature and Salinity profiles that go into that section plot.
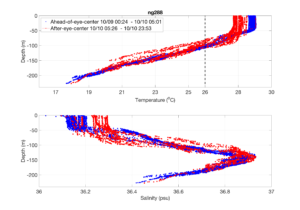
Above we see Maria’s plot of the temperature (top) and salinity (bottom) profiles reported by the Navy glider during the eye passage. Blue is ahead of eye center, red is after eye center. During this time we see a rapid temperature drop of about 1 C, and a deepening of the surface layer from about 50 m to about 90 m. For salinity, we see the salinity of the surface layer increase by about 0.1 psu.
Last 5 posts by Scott Glenn
- Early Season in the Mid Atlantic - June 17th, 2021
- Disturbance in the Gulf - June 16th, 2021
- Hurricane Gliders 2021 - May 3rd, 2021
- Hurricane Iota - November 16th, 2020
- Hurricane Eta - Low Wind Shear, High SST - November 2nd, 2020
