


-
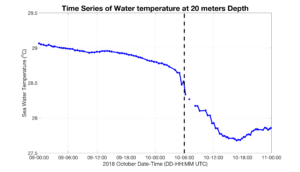
Time series of near surface temperature from Navy Glider
Posted on October 12th, 2018 No commentsHere we take a time series look at the near surface (2o m depth) temperature reported by the Navy Glider as Hurricane Matthew went by.
The time of eye passage is shown by the vertical dashed line. Temperature increase is at one slower rate until about 05:00 on Oct 10, just before eye passage. We then see a more rapid temperature decrease for about 8 hours, most of which occurs after eye passage. By about 17:00 the near surface temperature starts to increase slowly. So three ocean response time periods.
Next to check the model ….
-
Global Model profiles for Hurricane Michael
Posted on October 12th, 2018 No commentsBelow is the same plot as the Glider CTD data but for the Global Ocean Forecast System (GOFS) 3.1 model. Remarkably similar ocean. Differences are in the details.
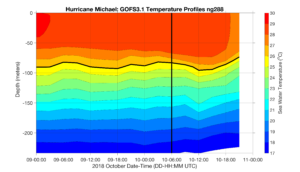
The 26C isotherm here is at a depth of about 90 m. The Navy glider has it at about 110 m, a bit deeper.
Surface layer cooling occurs more slowly in the model.
We will be looking into those details next.
-
Detailed CTD profiles in Hurricane Michael
Posted on October 12th, 2018 No commentsMaria is looking back at the CTD profiles collected during Hurricane Michael as it approached the Gulf Coast. In the figure below we have 2 days of CTD data from October 9 and 10. The 26C isotherm is indicated with a black line. The vertical black line 0n October 10 at 06:00 is the time of eye passage over the glider. The isotherms deepen most rapidly right after eye passage until about 09:00. Surface temperatures over the 2 days start between 29-30C and end between 27-28C.
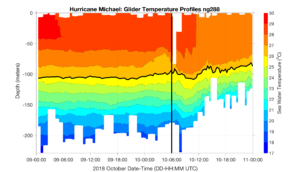
We will look at the time series of temperature at a depth near the surface, like 20 m, soon and get it posted.
