


-
Detailed CTD profiles in Hurricane Michael
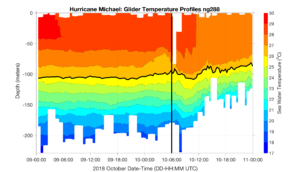
Posted on October 12th, 2018 No commentsMaria is looking back at the CTD profiles collected during Hurricane Michael as it approached the Gulf Coast. In the figure below we have 2 days of CTD data from October 9 and 10. The 26C isotherm is indicated with a black line. The vertical black line 0n October 10 at 06:00 is the time of eye passage over the glider. The isotherms deepen most rapidly right after eye passage until about 09:00. Surface temperatures over the 2 days start between 29-30C and end between 27-28C.
We will look at the time series of temperature at a depth near the surface, like 20 m, soon and get it posted.
Last 5 posts by Scott Glenn
- Early Season in the Mid Atlantic - June 17th, 2021
- Disturbance in the Gulf - June 16th, 2021
- Hurricane Gliders 2021 - May 3rd, 2021
- Hurricane Iota - November 16th, 2020
- Hurricane Eta - Low Wind Shear, High SST - November 2nd, 2020
