-
A quick check of the Satellite Altimetry
Posted on June 5th, 2020 No commentsHere is my new favorite place to look for satellite altimeter products in the Gulf of Mexico, the NOAA AOML site:
https://www.aoml.noaa.gov/phod/dhos/altimetry.php
I have been a long term user of the CCAR altimeter products for the Gulf, but I am not seeing it. Maybe our GCOOS friends have a recommendation for their go-to site for satellite altimetry. Was very happy to find this CoastWatch site from our friends at AOML. It has exactly the confirmation information we are seeking on the pre-storm ocean conditions.
In a previous blog post, we plotted the Sea Surface Height (SSH), and the surface currents, from the GOFS 3.1 model, noting that the Essential Ocean Features impacting hurricane intensity are well defined by SSH. Below is the CoastWatch altimeter product that plots the SSH (orange is high elevation, blue is low elevation) and the resulting geostrophic currents. The Loop Current flowing into and out of the Gulf is on the lower right. Nearly centered at 25N, 90W, is the large, warm core, Loop Current Eddy that Cristobal is forecast to track across tomorrow. Farther north and to the right of the forecast hurricane track is the Warm Eddy located just off the Florida panhandle continental shelf. In between the two warm, Anticyclonic eddies with the high elevations is the smaller area of low elevation associated with the cyclonic cold feature just south of the birdfoot. We clearly see the impact of the satellite altimeter in the data assimilative GOFS model.
It looks like we are being given a well designed laboratory experiment with a tropical storm tracking directly over the center of a warm Anticyclonic ring. Except that this one is real.
A next step will be to look for any of the operational regional HWRF runs that use the feature model initialization approach, and compare to the operational data-assimilative global GOFS model.
-
Argo Floats in the Gulf
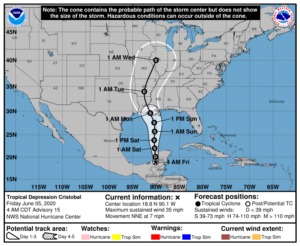
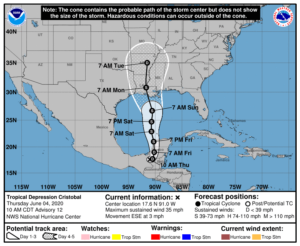
Posted on June 5th, 2020 No commentsNational Hurricane Center forecasters still have Cristobal following the 90W latitude line north across the Gulf starting this weekend
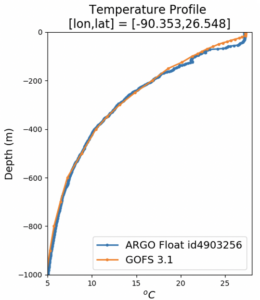
Here is a look at the Argo Floats in the Gulf that recently reported profiles between June 1-4. There are a couple near the north to south line along 90W.

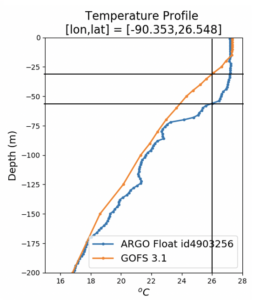
Below is a quick look at the first temperature profile compared to the Navy GOFS version 3.1. Everything below 200 m looks to be spot on. Above 200 m the observed Argo profile is a bit warmer, with a deeper mixed layer.
Zooming into the upper 200m, we can see the details of the warmer ARGO profile. Both have the same mixed layer temperature, but the mixed layer depth is less than 20 m and the argo float has it closer to 40 m. Using the depth of the 26C isotherm as another metric, we see it is about 30 m depth in GOFS and about 55 m deep in the Argo data.
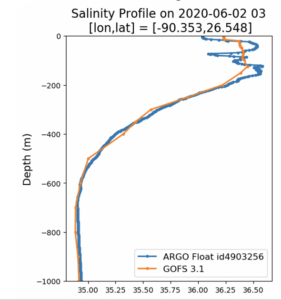
Now for the salinity comparison. As with temperature, the salinity comparison between GOFS and the Argo Float look very similar. In the upper 200 m, the salinity is much more variable. So lets zoom into the surface layer.
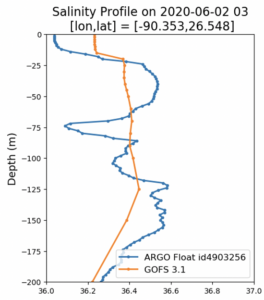
Below we zoom into the upper 200 m. Here the big question is the barrier layer. Temperature is nearly uniform down to a depth of about 50 m in the same profile, but the salinity profile indicates that there is a thin surface layer of low salinity water that is uncorrelated with the temperature. This is the critical barrier layer that inhibits mixing due to the resulting stratification. If we only had temperature observations, we might assume that the surface mixed layer is unstratified, and free to mix with the cold water below. The good news is that we do see the lower surface salinity in the GOFS model, but in the model, the low salinity surface layer is about 20 m deep and the temperature mixed layer is about 20 m deep. So the characteristics of the barrier layer are different. Salinity and temperature are well correlated in the upper layer of model, and are independent in the upper layer of the data.
More comparisons to come as we work through the day.
-
Forecast Tropical Storm Cristobal
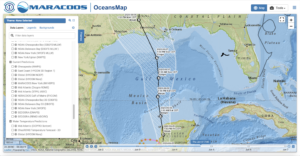
Posted on June 4th, 2020 No commentsIt starts with the National Hurricane Center, with a forecast track for Cristobal going up the Yucatan Peninsula, across the Gulf of Mexico and into the Gulf Coast.
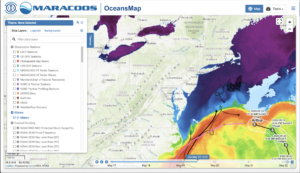
I then turn to my favorite product visualizer, the MARACOOS OceansMap. Below is a map of the forecast track for Cristobal over the bathymentry of the Gulf of Mexico. Here we see that Cristobal is forecast to travel over the shallow Yucatan Shelf Saturday morning, then cross the very steep Campeche Escarpment into deep water. Cristobal then spends Saturday afternoon through Sunday morning over the deep Gulf of Mexico. On Sunday afternoon Cristobal starts making its way across the Louisiana – Texas continental shelf towards eventual landfall.
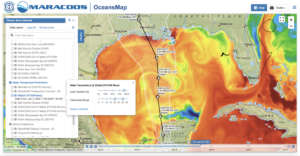
Next we use OceansMap to look for the Essential Ocean Features impacting hurricane intensity. The Essential Ocean Features in the Gulf of Mexico are the very warm Loop Current, the warm and cold eddy features, and the fresh water from the Mississippi. The Loop current enters the Gulf through the Yucatan Straits between Mexico and Cuba, forms and inverted U shaped loop inside the Gulf, and exits the Gulf through the Straits of Florida between the Keys and Cuba. The largest Loop Current Eddies break off from the Loop Current and travel Westward across the Gulf through the deepwater region noted above. Below we look for these Essential Ocean Features using OceansMap.
In OceansMap we first bring up the Navy Global Ocean Forecast System version 3.1, based on the HYCOM model. This is the model that assimilates all the ocean data for the hurricane forecasts, making it the critical first step in getting the ocean right. The nice thing about OceansMap is that the images can be manipulated in my web browser, so I can vary the enhancement. Below we have plotted the GOFS 3.1 Sea Surface Temperature field and adjusted the color bar to highlight temperatures between 20C (blue) and 30C (red). The warm Loop Current is easy to see entering the Gulf, extending somewhat less than half way north, and sharply turning back south, running along the West Florida Shelf to exit through the Florida Straits. We then move to identifying the eddies in our census of Essential Ocean Features. The most critical are known as Anticyclonic Eddies due to their clockwise circulation patterns. They are also known as Warm Eddies, since they have a deep warm subsurface structure that we don’t see in these surface maps, and warm water is the fuel for hurricane intensity. Looking for regions of clockwise circulation we see two, one large area right under the forecast track of Cristobal. Cristobal is forecast to be over this warm water feature Saturday 1 pm to Sunday 1 am. This is the location to watch. The other clockwise circulation feature is to the right of the storm track up against the West Florida Escarpment. The next set of Essential Ocean Features are the Cyclonic Eddies, with counterclockwise circulation and a subsurface structure that is cold. The cold water in these eddies have the effect of trying to weaken the storm. One of these Cyclonic Eddies are located just south of Louisiana birdfoot, between the two Anticyclonic eddies noted above. There also appears to be very cold upwelled water on the shallow water of the Yucatan Shelf, and in the shallow water of the West Florida Shelf.
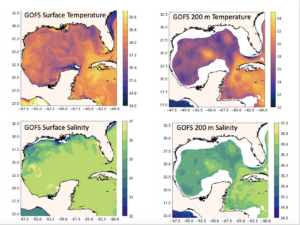
The OceansMap view of the Essential Ocean Features in the Gulf of Mexico prompts us to look deeper into Navy GOFS 3.1 model. Below are plots of the temperature (top row) and salinity (bottom row) from GOFS model on June 4, 2020. Surface values are on the right column and values at 200 m depth are in the left column. For surface temperature (upper right) the features seen in OceansMap are reproduced. They include the Loop Current, the two Anticyclonic eddies, and the one Cyclonic eddy in between. Looking at the temperature at 200 m depth, a depth below the seasonal thermocline, we see these features are well defined by their temperature structure. The anticyclonic eddies defined by their circulation at the surface are well defined by their warm cores. The cyclonic eddy is well defined by its cold core.
Now we look at the salinity in the bottom row. The surface salinity shows us the location of the Essential Ocean Features called barrier layers. These layers are barriers to mixing and enable the ocean to stay warm longer, contributing more to the intensification of the hurricane than it would if no barrier layer was present. In this view of the surface salinity, we see the Mississippi River plume and how it is spread along the Louisiana-Texas continental shelf. At 200 m, below the seasonal thermocline & halocline, the subsurface salinity map highlights different features than in the surface map. The large scale Loop Current and Eddies that we see in the 200 m temperature layer are reinforcing the way we define the anticyclonic eddies – that they have warm, high salinity waters that extend well below the surface.
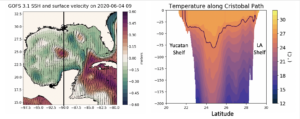
Below we look at a map of the sea surface height (SSH) on the left. The surface circulation we are using to define the Anticyclonic and cyclonic eddies is related to the variations in sea surface height. Anticyclonic circulation occurs around a high (red color) in the SSH. Cyclonic circulation occurs around the low elevations (blue) in the SSH. The eddies are very visible in the SSH fields, which illustrates the importance of the satellite altimeters to define the Essential Ocean Features in the Gulf of Mexico.
On the right we show a vertical temperature section running from south to north along 90W marked by the black line in the SSH map. In the vertical temperature section, the 26C isotherm is marked by the black line. In this case, 26C is also near the base of the surface mixed layer. The 26C isotherm is typically 25m to 40 m deep, except within the warm core ring, where the 26C isotherm extends to a depth of about 80 m. We also see that most of the variability in the model is in the upper 100 m. At about 200 m, the water is relatively cool except for the warm water in the core of the ring.
-
TS Arthur tracks along the Gulf Stream
Posted on May 19th, 2020 No commentsBelow is the view of Tropical Storm Arthur in the MARACOOS OceansMap. https://oceansmap.maracoos.org/
The track of Arthur follows the warm water of the Gulf Stream observed in the satellite SST. Arthur is forecast to now turn more towards the south. Arthur tracked close to 2 gliders that were flying in the Gulf Stream, Silbo operated by TWR and a spray glider operated by WHOI. Silbo in black is shown leaving the Gulf Stream to the north while the Spray glider in gray continues west with the Stream. Currents from the MARACOOS HF Radar network on the Mid Atlantic shelf are strong and alongshore towards the south.

A quick look at the global model temperature profiles as Glider Silbo leaves the Gulf Stream looks like a much faster departure in the models than in the real world. We’ll look more at the slope sea comparison when the glider is out of the Stream in both the model and real world conditions. Plots from all the gliders can be viewed at https://rucool.marine.rutgers.edu/hurricane/Hurricane_season_2020/
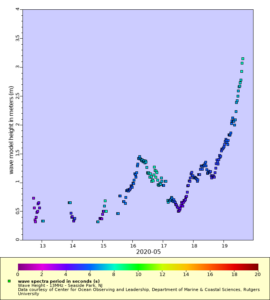
NHC warnings included heavy surf along the Mid Atlantic coast from Arthur. Some of the HF Radar systems in the Mid Atlantic are set up to monitor waves in real time and send the data to the NWS forecast offices. Above is one example of HF Radar derived waves along the NJ coast at Seaside Park, the first site to break 3 m. Waves from the NDBC sites further offshore are approaching 9 ft. The full HF Radar waves dataset can be accessed at
https://marine.rutgers.edu/~hroarty/maracoos/ERDDAP_MAB_HFR_Wave_Data_v2.html
-
TS Arthur forecast to turn just south of the gliders
Posted on May 18th, 2020 No comments
Tropical Storm Arthur is forecast to move parallel to the North Carolina coast today. The morning forecast discussion from the National Hurricane Center indicates that “Arthur is moving near and almost parallel to the Gulf Stream”. Several gliders are deployed in the slope sea or Gulf Stream just north of the forecast track, with glider Silbo being in the most southern position.

In the above figure temperature profiles from the global models are compared to glider Silbo. Profiles from the U.S. data assimilative GOFS and the operational RTOFS have similar features and agree well above 400 m and below 800 m. The transition between the 18C water near 300 m depth and the 7C water near 800 m depth is often related to differences in the position of the Gulf Stream. The global model from Copernicus starts near the same surface temperature, likely due to similar satellite Sea Surface Temperatures being assimilated, and is similar in the deep water at 1000 m, but what happens in between is has a very different shape.
-
New 2020 Ocean Forecast Workflow for Hurricanes
Posted on May 15th, 2020 No comments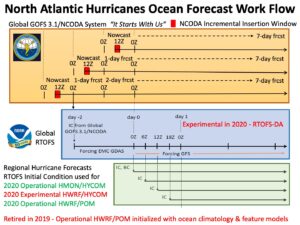
There are 3 steps in the workflow for the ocean component of NOAA’s operational hurricane forecast models HMON and HWRF.
Step 1 is data assimilation. This is accomplished by the Navy using the Global Ocean Forecast System (GOFS) version 3.1. The data is assimilated using the Navy Couple Ocean Data Assimilation (NCODA) system. Data from each day is typically inserted over a 3 hour insertion window running from 9Z to 12Z each day. Major datasets for assimilation include satellite Sea Surface Temperature (SST), satellite sea surface height from altimeters, data from profiling instruments like Argo and underwater gliders, etc.
Step 2 is to layer on the NOAA global windfield from GFS. Here the NOAA global Real Time Ocean Forecast System (RTOFS), starting at day 0, looks back 2 days and extracts from GOFS 3.1 its initial condition (IC). That initial condition is then run forward back up to day 0 without data assimilation with forcing from the EMC GDAS. Then on day 0, the wind forcing is switch to GFS to run RTOFS for several days into the future. Starting in August 2020, it is anticipated that and experimental version of RTOFS Data Assimilation (RTOFS-DA) will be run. Thus there are 3 US global ocean models to compare to observations this coming hurricane season – operational GOFS3.1 with NCODA, operational ROTFS without data assimilation, and experimental RTOFS with RTOFS-DA. We hope to expand this to include the European global ocean forecast system available through Copernicus.
Step 3 is to extract initial conditions (IC) and Boundary Conditions (BC) from RTOFS every 6 hours to initialize the regional ocean models that are coupled to the atmospheric forecast models HMON and HWRF. The operational HMON atmospheric model is coupled to a regional HYCOM ocean model. The HWRF atmospheric model is coupled to both HYCOM and POM ocean models. It is anticipated that for the 2020 hurricane season, the operational HWRF will be coupled to POM, and an experimental HWRF will be coupled to HYCOM. This makes at least 3 different oceans that will be present under hurricanes this season. The commonality in 2020 is that all 3 oceans will start from the same initial condition provided by ROTFS every 6 hours. The difference will be what ocean model and what windfield is used to evolve the initial conditions, and how much difference that makes during the storm forecast.
-
RUCOOL Updates: February to March, 2020
Posted on May 15th, 2020 No commentsDespite the COVID-19, RUCOOL remains active and excelling. Core technologies (storm gliders and HF Radar) were deemed critical research tools based on national security requirements and continue to be supported. These activities are guided by an operations plan that maintains recommended self-distancing practices. In fact, RUCOOL has developed standard operating procedures for glider deployments leveraging social distancing requirements, which have been shared with multiple funding agencies and research partners. The operating guidelines are available upon request.
State
- In early April, the first operational oceanography Masters students will be submitting abstracts of their thesis to the Marine Technology Society OCEANS meeting. One of the Masters students has already accepted a job working for NOAA’s operational oceanography service following her degree.
- RUCOOL initiated two projects with Atlantic Shores Offshore Wind, the joint NJ offshore wind project between EDF Renewables and Shell New Energies. One project is installing a vertically pointing wind lidar at the Rutgers Marine Field Station. The second is a modeling study of visibility conditions along the NJ coast.
- RUCOOL hosted Commissioner Dianne Solomon of the New Jersey Board of Public Utilities for a tour and discussion of offshore wind.
- In March, 4-H launched a Virtual 4-H at Home Short Term Exploratory Program (STEP). The program was entitled: Exploring Life in the Southern Ocean and consisted of three 1.5 hour classes geared towards 5th-8th grade students – see https://4hset.rutgers.edu/online-learning/. Young people from across the state participated in this inaugural program led by the RUCOOL education team.
- To fill the gap of in person 4-H STEM learning due to COVID-19, the RUCOOL education team has joined a larger Rutgers group that has created a new 4-H STEM Blog to help kids connect to STEM activities from home: https://4hset.rutgers.edu/stem-blog/.
National
- Grace Saba presented an invited to Sea-Bird Scientific on the glider pH efforts and path forward for an industry-academic partnership. Grace runs the only two pH gliders in the world.
- The RUCOOL Education and Science teams lead the authoring of a special issue for the National Marine Educators Association Journal called Current – https://polar-ice.org/nmea_current/https://polar-ice.org/nmea_current/
- Hugh Roarty travelled to Vessel Traffic Service (VTS) Centers around the United States (Port of New York, Houston, Louisville and Port Arthur) to evaluate the Coast Guard use of HF radar to manage traffic in the ports. Existing microwave radars operated by the United States Coast Guard (USCG) do not provide reliable detection of small vessels. Hugh will meet with Coast Guard personnel at the twelve MORE VTS centers and develop a needs analysis with respect to radar remote sensing.
- For the NASEM HF-Radar work in the Gulf of Mexico, RUCOOL is improving CODAR ship detection software. Tests are being performed by comparing data acquired near two oil platforms in the Gulf of Mexico and from the Sandy Hook NJ site, to the national Automated Identification System (AIS) ship tracking data.
International
- RU COOL scientists working on the NSF-funded Palmer LTER and Project SWARM connected with thousands of K-12 students this past winter in 10 live video teleconferences (VTCs) from Palmer Station, Antarctica. The education team recruited and prepared 25 teachers from 21 schools in 11 states (NJ, DE, NY, CT, VA, FL, AL, MN, AZ, OR, CA), reaching 1060 students directly and many more via the call recordings that are shared online. The interaction helps build science identity as reported by teachers.
- Several members of the RUCOOL team attended the Ocean Sciences meeting in San Diego in late February, which is the world’s largest oceanography conference, delivering 20 presentations (many are available on our website). Grace Saba co-chaired the town hall on Exploration of the Twilight Zone Ocean Network (JETZON), which published a piece in Nature last week
- The RUCOOL team collected data for the last 30 years as part of the NSF funded Palmer Long Term Ecological Research program, that is conducting a long term study of how a changing climate will impact polar marine ecosystems along the West Antarctic Peninsula (WAP). This year leadership of the Palmer LTER was transferred to Rutgers which is the principal institution running this multi-university long term effort.
- RUCOOL lead a team partnered with the University of Delaware, Oregon State University, Old Dominion University, Polar Oceans Research Group, and University of Alaska Fairbanks to deploy a polar ocean observatory off the coast of Antarctica. COVID-19 provided a challenge with travel logistics as scientists and students were scheduled to arrive home in late March. The entire team arrived home safely in late March, thanks to a great deal of help, cooperation and communication between gov’t agencies, airlines and universities. It’s good to have them back.
Student Awards
- Kasey Walsh, Grace Saba’s undergraduate student, received the Undergraduate Research Excellence Award from the Department of Marine & Coastal Sciences.
Newly Funded Research
- EDF Renewable 2020-2021, “Atlantic Shores Visibility Modeling Study” ($15,489), Joe Brodie.
- EDF Build 2020-2021, “RUMFS Atlantic Shores Lidar Deployment” ($68,885), Joe Brodie.
- Stevens Institute of Technology, Department of Homeland Security, “VTS Radar for Small Vessel Detection” ($192,473), Hugh Roarty.
- National Science Foundation 2020, “LTER Palmer, Antarctica (PAL): Land-Shelf-Ocean Connectivity, Ecosystem Resilience and Transformation in a Sea-Ice Influenced Pelagic Ecosystem”, ($1,134,426), Oscar Schofield.
- National Science Foundation 2020, “REU Site: Research Internships in Ocean Sciences (RIOS)”, ($498,502), Josh Kohut
Papers Published: (**Current or Former Graduate Student or Postdoctoral Researchers)
- Martin, A., Boyd, P., Buesseler, K., Cetinic, I., Claustre, H., Giering, S., Henson, S., Irigoien, X., Kriest, I., Memery, L., Robinson, , Saba,G., Sanders, R., Siegel, D., Alfageme, M.V., Guidi, L. 2020. Study the twilight zone before it is too late. Nature 580: 26-28, DOI: 10.1038/d41586-020-00915-7
- Hunter-Thomson, K., Kohut, J., Saba, G.Empowering Students with Polar Science Through Real World Data. Current: The Journal of Marine Education 34(1): 13-18.
- Greengrove, C., Lichtenwalner, H. Palevsky, A. Pfeiffer-Herbert, S. Severmann, D. Soule, S. Murphy, L. Smith, and K. Yarincik (2020), Using Authentic Data from NSF’s Ocean Observatories Initiative in Undergraduate Teaching: An Invitation, Oceanography, 33(1), DOI:10.5670/oceanog.2020.103.
- Ferraro, C., Jordan, R., Kopp, R. E., Bond, S. L., Gong, J., Andrews, C. J., Auermuller, L. M., Herb, J., & McDonnell, J.(2020). Training Students to Improve Coastal Resilience. In A. Zimmerman (Ed.), Preparing Students for Community-Engaged Scholarship in Higher Education (pp. 347-360). Hershey, PA: IGI Global. DOI:10.4018/978-1-7998-2208-0.ch017
- McDonnell, J., Hotaling, L., Schofield, O., Kohut, J.(2020). Key concepts in polar science: Coming to consensus on the essential polar literacy principles. Currents: Journal of Marine Education. 34(1): 2-8
- McDonnell, J., Schofield, O., Bean, C.Bringing long-term ecological research (LTER) at Palmer Station Antarctica to your classroom. Currents: Journal of Marine Education. 34(1): 15-17
RUCOOL Meetings & Conferences
AGU Ocean Sciences, San Diego, CA; Schmidt Foundation, San Diego, CA; IOOS Annual Meeting, Washington, DC; USCG Meetings at Port of New York, Houston, Louisville and Port Arthur, TX; Swam Research, Palmer Station, Antarctica; Rhode Island Parks Conference, Rhode Island; Tropical Cyclone Operations and Research Forum, Lakeland, FL.
RUCOOL Visitors
- Total number of visitors to RU COOL: 75 (Lab was shut down for tours on March 6 due to COVID-19)
-
RUCOOL Updates: December 2019 – January 2020
Posted on April 27th, 2020 No commentsState
- Our Operational Oceanography students presented their thesis proposals to the PIs in December and have begun thesis work. Second cohort student applications have arrived, doubling those from the first cohort.
- The R/V Rutgers field season ended in November and the maintenance season began in December. There were no science cruises, but significant maintenance/repairs/additions have been completed supporting USCG inspections and preparing for the spring season ahead.
- Carl Gouldman, Director of NOAA’s US Integrated Ocean Observing System (IOOS) visited RUCOOL to view final presentations from our undergraduate research class. Carl Goldman shared his career experiences with the students, while they presented talks on typhoons and hurricanes in the Atlantic and Pacific, research on climate in Antarctica, and local studies of the Raritan River.
National
- Janice McDonnell’s education team has and will continue to offer weekly video teleconferences for the Antarctic LTER program and Dr. Josh Kohut’s SWARM project. The virtual visits to our Antarctic summer researchers are reaching thousands of K-12 students during our winter.
- The Ørsted ECO-PAM Marine Mammal project, a collaboration between Ørsted, RUCOOL, Woods Hole Oceanographic Institution, and the University of Rhode Island was formally announced. RUCOOL has ordered a new Slocum glider exclusively for the use of this project, with the first deployment anticipated this spring. This first beta project has the possibility of leading to a decade of glider whale tracking during wind turbine installations off NJ.
- Grace Saba and graduate student Liza Wright-Fairbanks attended the Ocean Acidification Community Meeting in Miami, FL. Each presented aspects of their novel research using newly developed glider-based pH sensors to observe carbonate chemistry variability in dynamic coastal shelf systems. A recent article on Grace’s work is available at: https://rucool.marine.rutgers.edu/gliding-into-the-future-of-ocean-acidification-observing/
- Josh Kohut and Joseph Brodie served as panelists for a discussion on international research in sustainability and climate change hosted by Rutgers Global.
- The education team conducted three webinars for the Data Lab project (datalab.marine.rutgers.edu) including pedagogically focused programs by the project team, and webinars that were led by the previous workshop participants as we grow our core.
- After offering a mini grant competition, the education team awarded 11 Data Lab Fellows to expand the use of NSF’s OOI data. You can learn more about the competition here: https://datalab.marine.rutgers.edu/2020-data-labs-fellows/
- The RUCOOL Hurricane glider team was granted access to NOAA supercomputers this winter. Maria Aristizabal is now charged with evaluating the accuracy of the NOAA/NCEP operational and experimental hurricane forecasting models in estimating the ocean’s response to Hurricane Dorian using a fleet of underwater gliders deployed in the Caribbean Sea.
- Scott Glenn, a member of the Environmental Information Services Working Group (EISWB), attended the EISWG annual meeting at the NOAA Storm Center in Norman Oklahoma (Univ. of OK). Scott presented a talk on the impacts of oceans on hurricane forecasts. He will now lead the EISWG review of the NOAA Hurricane Forecast Improvement Program (HFIP) submitted in response to the Weather Research and Forecast Innovation Act of 2017.
- Scott Glenn and Mike Smith attended the Understanding Gulf Ocean System (UGOS) collaboration meeting at the National Academy of Sciences Engineering and Medicine headquarters in Washington, DC. Mike presented a poster on HF-Radar data quality control and data management.
International
- RUCOOL, the University of Delaware and University of Alaska Fairbanks have partnered on the Swarm project studying the ocean off the West Antarctic Peninsula. Swarm focuses on integrating multiple sensors and technologies to improve models of phytoplankton blooms, krill locations and maps of top predator locations off the West Antarctic Peninsula. Since December, Rutgers has and continues to operate 3 gliders and the only Antarctic HF-Radar station in support of this research.
- Rutgers (Travis Miles) partnered with the French National Centre for Scientific Research (CNRS) and Ifremer on a collaborative project focused on sampling particle fluxes and the dynamics of the Rhone River along the southern coast of France using an ocean glider.
- Oscar Schofield served as Chief scientist for the 8 week 2020 expedition to Antarctica as part of the NSF funded Palmer Long Term Ecological Research program, which is conducting a long term study of how a changing climate will impact polar marine ecosystems along the West Antarctic Peninsula (WAP). The WAP is the fastest warming winter location on Earth. RUCOOL has documented major changes in the food web which is being driven by a changing ocean. The changes have ranged from the base of the food web and declines in the penguin populations.
- Hugh Roarty visited with Erick Fredj from Jerusalem College of Technology in Jerusalem, Israel in January. They discussed the state of the art for measuring and quantifying oceanic surface transport in the Mid Atlantic Bight. They plan on conducting an experiment this coming summer looking to measure ocean dispersion with drifters and HF-Radar.
- RUCOOL attended the NOAA Korean Institute of Ocean Science and Technology Joint Program Agreement Meeting in Busan, South Korea to continue work on the typhoon Soulik data set and to plan for the next joint glider deployment during the 2020 typhoon season.
Newly Funded Research
- Orsted 2020-2021, “Marine Mammal Real Time Automated Detection and Oceanographic Sampling Project”, ($1,109,786), Brodie, (2 years of funding).
- Department of Homeland Security (Stevens Institute of Technology) 2020, “VTS Radar for Small Vessel Detection”, ($192,473), Roarty (1 of 1).
- University of Puerto Rico 2017-2021, “Advancing Coastal Intelligence in the US Caribbean”, ($67,656), Roarty (4 of 5).
- National Science Foundation Infrastructure Capacity for Biology 2019-2020: “Expanding the biological/physical sampling at Rutgers Marine Field Station at Tuckerton”, ($149,679), Schofield, Able, Grothues, Kohut, Saba.
- Vetelsen Foundation (2020), “Support for improving hurricane prediction in the Caribbean”, ($100,100) Glenn, Schofield, Miles, Kohut, and Saba.
Faculty Awards
- Travis Miles received the RBR2020 Cohort Award. This award is open to early-career researchers and will bring together scientists from around the world to enable innovative ocean measurements through collaborative workshops, technical developments, demonstration programs, and SciComm mentorship.
Papers Published: (**Current or Former Graduate Student or Postdoctoral Researchers)
- Hudson, K., Oliver, M.J., Bernaerd, K., Cimino, M., Fraser, W., Kohut, J., Statscewich, H., and Winsor, P. 2019. Reevaluating the canyon hypothesis in a biological hotspot in the Western Antarctic Peninsula. Geophys. Res. Oceans. doi: 10.1029/2019JC015195.
RUCOOL Meetings & Conferences
Meetings during this two month reporting period included: Dupont Nature Center HF-Radar Meeting, Milford DE; MarineRTech Meeting, Lisbon; Ocean Best Practices Meeting, Brussels; Korea Institute of Ocean Science and Technology Meeting, Busan; American Meteorological Society Meeting, Boston; OOI Data Labs Workshop (moderators), Princeton; Jerusalem College of Technology, Jerusalem; Environmental Information Services Working Group Meeting, Norman OK; Understanding Gulf Ocean Systems Meeting, Washington DC.
RUCOOL Visitors
- Total number of visitors to RU COOL: 58
-
RUCOOL Update for October-November 2019
Posted on December 18th, 2019 No commentsState
- Grace Saba conducted the first Delaware Bay field effort designed to observe zooplankton ingestion of microplastics and the effect on fecal pellet sinking rates. Experiments were conducted at the Haskin Shellfish Research Laboratory.
- Masters students attended the Urban Coast Institute’s Future of the Ocean Symposium where they met and learned from leaders in operational oceanography including the deputy administrator of NOAA, the president of Conservation Law Foundation, the deputy director of the Port Authority of NY & NJ, and the president of Orsted U.S. Offshore Wind.
- In addition to participating in three glider deployments (one entirely student led) and an HF radar installation, students have been building their own ocean instruments (CTD) from scratch.
- The R/V Rutgers completed 15 trips, hosting 150 passengers during October and November. These trips included support of glider deployments and recoveries, completing multiple experiments on marsh restoration and water quality, supporting seven undergraduate classes, and outreach cruises with citizen scientists and SEED (Students for Environmental and Energy Development).
National
- With the exception of RU26 currently deployed off the coast of California, the 2019 underwater glider season was completed in November. During October and November, RUCOOL was involved with seven glider deployments and nine glider recoveries, taking our total glider deployments to over 500. These deployments include work supporting NOAA funded hurricane research, a MARACOOS Cold Pool study, NJDEP water quality research along the NJ coast, NASA investigations along the California coast validating data from a new sea surface height satellite, an NSF funded pH study in the Mid Atlantic, Vetelsen funded investigations of hurricane interactions with the ocean surface in the Caribbean, and piloting support of the first glider at Stony Brook funded by an NYDEC project. It was a busy ending to a busy year, but next year we could see a 20-40% increase in glider work. Stay tuned!
- RUCOOL attended the Coastal Ocean Modeling Testbed Meeting hosted by IOOS where Travis Miles presented on in situ measurements and data assimilation impacts on tropical cyclone forecasts. RUCOOL continues to be the national leader in improving both the ocean observation and modeling systems for hurricane research.
- RUCOOL continues to work directly with the National Centers for Environmental Prediction (NCEP). Maria Aristizabal is working with the hurricane forecasting group to evaluate the ocean-initial conditions in the operational and experimental NWS hurricane forecasting system using the data from the glider fleet that was deployed around Puerto Rico and the U.S. Virgin Islands this summer and fall. It has become clear that glider data assimilation has a significant impact on improving the accuracy of the initial conditions.
- Hugh Roarty led sessions at the WTRIM (Wind Turbine Radar Interference Mitigation) meeting with federal partners (Dept of Defense, Energy, FAA, BOEM and NOAA) that focused on how to secure funding for mitigation of interference from offshore wind turbines on the mid-Atlantic HFR network.
- The education team hosted four Ocean Data Labs Webinars (datalab.marine.rutgers.edu) geared for community college professors. Topics included designing effective learning experiences, designing lessons based around data, and training on why salinity changes and what causes anoxic events. Additionally, the team completed a six minute movie entitled “Data as a Tool in Scientific Investigations”, which will be available publicly in December, but you can view it here.
International
- Josh Kohut visited PLOCAN (Oceanic Platform of the Canary Islands) and Puertos del Estado in Spain to assist with annual glider training, focused on the end user applications and science. This international collaboration focused on ocean education continues into its second decade.
- Scott Glenn visited Palmer Station to install the only HF-Radar network in Antarctica, funded through the NSF. The project studies the foraging ecology of polar marine food webs and their connection to the ocean. The core research will occur January-March of 2020.
- Oscar Schofield traveled to Barbados as he was invited to provide overviews on new ocean technologies for Hurricane forecasting to the Weather Prediction Ministers from the islands of the southern Caribbean. The meeting was organized by the Varysian group.
- Oscar Schofield was invited to give two talks at Oceanology International. The first presentation was about the United States Integrated Ocean Observing System and a second was on evolving sensor technology for underwater autonomous robots. During that visit he gave a third invited talk at the State Key Research Laboratory in Shanghai.
- Members of the RUCOOL team attended the Marine Technology Society Meeting in Seattle, WA. The team chaired technical sessions, presented multiple talks on RUCOOL research, but more importantly had several focused meetings that are expected to lead to future research partnerships, collaboration with private companies on new sensor testing, and discussion with numerous potential future graduate students.
Fall Semester Classes
- Undergraduate: Freshmen Oceanography House (Glenn, Kohut, Schofield); Ocean Observatories Research (Glenn, Kohut, Schofield); Oceanographic Methods and Data Analysis: Biology/Chemistry (Saba); The Biology of Living in the Ocean: Water Column, Ecosystems & Processes (Saba).
- Graduate: Integrated Ocean Observing 1 (Beaird); Field Laboratory Methods 1 (Beaird); Operational Ocean Modeling/Visualization 1 (Miles, Beaird); Integrated Ocean Observing – Software Bootcamp (Beaird).
Student Awards
- Graduate Student Emily Slesinger won Best Student Oral Presentation at the Mid-Atlantic Chapter American Fisheries Society (MACAFS) meeting in Lewes, DE in November: https://mid-atlantic.fisheries.org/2019-annual-meeting/
Papers Published: (**Current or Former Graduate Student or Postdoctoral Researchers)
- Julia N. Kobelt, William C. Sharp, Travis N. Miles, Colette J. Feehan (2019). Localized Impacts of Hurricane Irma on Diadema antillarum & Coral Reef Community Structure. Estuaries and Coasts. DOI:10.1007/s12237-019-00665-4.
- Saba, G.K., Wright-Fairbanks, E., Chen, B., Cai, W.-J., Barnard, A.H., Jones, C.P., Branham, C.W., Wang, K., Miles, T. The development and validation of a profiling glider Deep ISFET pH sensor for high resolution coastal ocean acidification monitoring. Frontiers in Marine Science 6: 664, DOI:10.3389/fmars.2019.00664.
RUCOOL Meetings & Conferences
Meetings during this two month reporting period included: Coastal Ocean Modeling Testbed Meeting, Silver Spring, MD; American Wind Energy Association Meeting, Boston, MA; MARACOOS Annual Board Meeting, Baltimore, MD; Marine Technology Society Meeting, Seattle, WA; Wind Turbine Radar Interference Meeting, Travis Air Force Base, CA; National Centers for Environmental Prediction, College Park, MD; NJ Board of Public Utilities Meeting, Trenton, NJ; Oceanology International, Shanghai, China; Polar-ICE Polar Literacy Meeting, New Brunswick, NJ; IEEE Ocean Engineering Society, Seattle, WA; Weather Prediction Ministers of the Caribbean, Barbados; MARACOOS Strategic Planning Meeting, Lewes, DE; Monmouth University Regional Awards, West Long Branch, NJ; National Geoscience Education Meeting, Carlton College, Northfield, MN; Glider Training School, Canary Islands, Spain; Offshore Wind Transmission Workshop, Trenton, NJ; Polar CAP Kickoff meeting, New Brunswick, NJ.
-
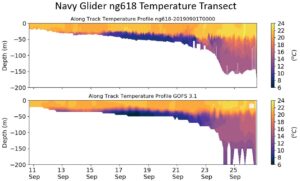
Navy Gliders View the Cold Pool
Posted on October 25th, 2019 No commentsTwo Navy gliders were deployed in the Middle Atlantic Bight (MAB) between September 11 & 26, 2019. Their cross-shore trajectories were planned to capture the cold pool, a cold bottom layer of water that characterizes the MAB at this time of the year. There transects are shown below.
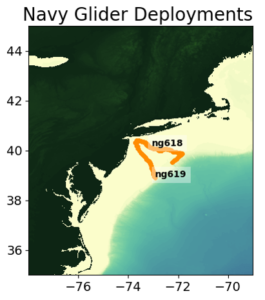
In the figures below, the top figure shows the cross-shore temperature transect for glider ng618. In this figure the cold pool can be identified as the bottom water with temperature less than 10 degrees Celsius. The cold pool has important implications for the fisheries of the region and it can become a “fire extinguisher” for tropical cyclones by lowering the sea surface temperature through vertical mixing during the passage of a storm.
The bottom figure shows the same ng618 glider trajectory from the Global Ocean Forecasting System (GOFS 3.1) that is a global operational ocean model run by the US Navy. The comparison between glider observations and the GOFS model are remarkably good.