


-
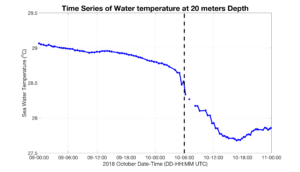
Time series of near surface temperature from Navy Glider
Posted on October 12th, 2018 No commentsHere we take a time series look at the near surface (2o m depth) temperature reported by the Navy Glider as Hurricane Matthew went by.
The time of eye passage is shown by the vertical dashed line. Temperature increase is at one slower rate until about 05:00 on Oct 10, just before eye passage. We then see a more rapid temperature decrease for about 8 hours, most of which occurs after eye passage. By about 17:00 the near surface temperature starts to increase slowly. So three ocean response time periods.
Next to check the model ….
-
Global Model profiles for Hurricane Michael
Posted on October 12th, 2018 No commentsBelow is the same plot as the Glider CTD data but for the Global Ocean Forecast System (GOFS) 3.1 model. Remarkably similar ocean. Differences are in the details.
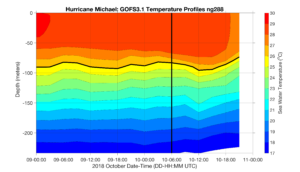
The 26C isotherm here is at a depth of about 90 m. The Navy glider has it at about 110 m, a bit deeper.
Surface layer cooling occurs more slowly in the model.
We will be looking into those details next.
-
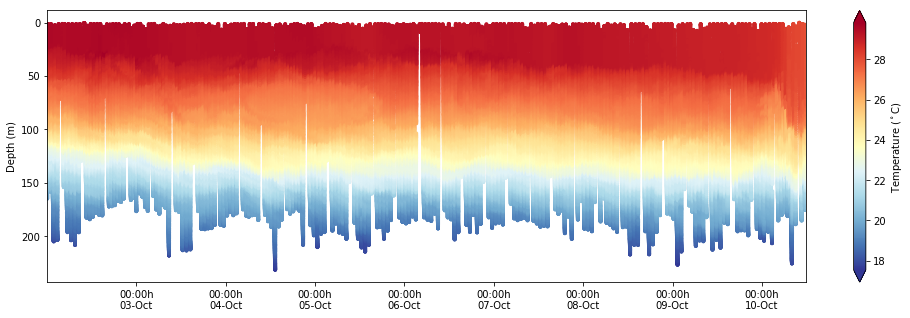
Detailed CTD profiles in Hurricane Michael
Posted on October 12th, 2018 No commentsMaria is looking back at the CTD profiles collected during Hurricane Michael as it approached the Gulf Coast. In the figure below we have 2 days of CTD data from October 9 and 10. The 26C isotherm is indicated with a black line. The vertical black line 0n October 10 at 06:00 is the time of eye passage over the glider. The isotherms deepen most rapidly right after eye passage until about 09:00. Surface temperatures over the 2 days start between 29-30C and end between 27-28C.
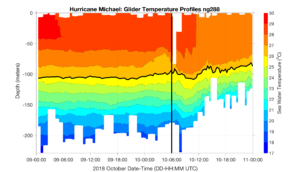
We will look at the time series of temperature at a depth near the surface, like 20 m, soon and get it posted.
-
Navy Glider Temperature and Salinity Profiles during eye passage.
Posted on October 11th, 2018 No commentsIn the previous post, Travis showed the plot of the CTD temperature section from the Navy glider operating just to the right of the path of Hurricane Michael. Here is our first look at the actual Temperature and Salinity profiles that go into that section plot.
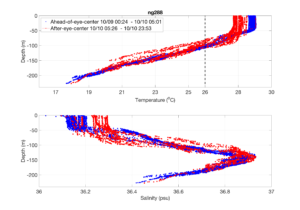
Above we see Maria’s plot of the temperature (top) and salinity (bottom) profiles reported by the Navy glider during the eye passage. Blue is ahead of eye center, red is after eye center. During this time we see a rapid temperature drop of about 1 C, and a deepening of the surface layer from about 50 m to about 90 m. For salinity, we see the salinity of the surface layer increase by about 0.1 psu.
-
Michael Gulf of Mexico SST anomaly and ocean response
Posted on October 11th, 2018 No comments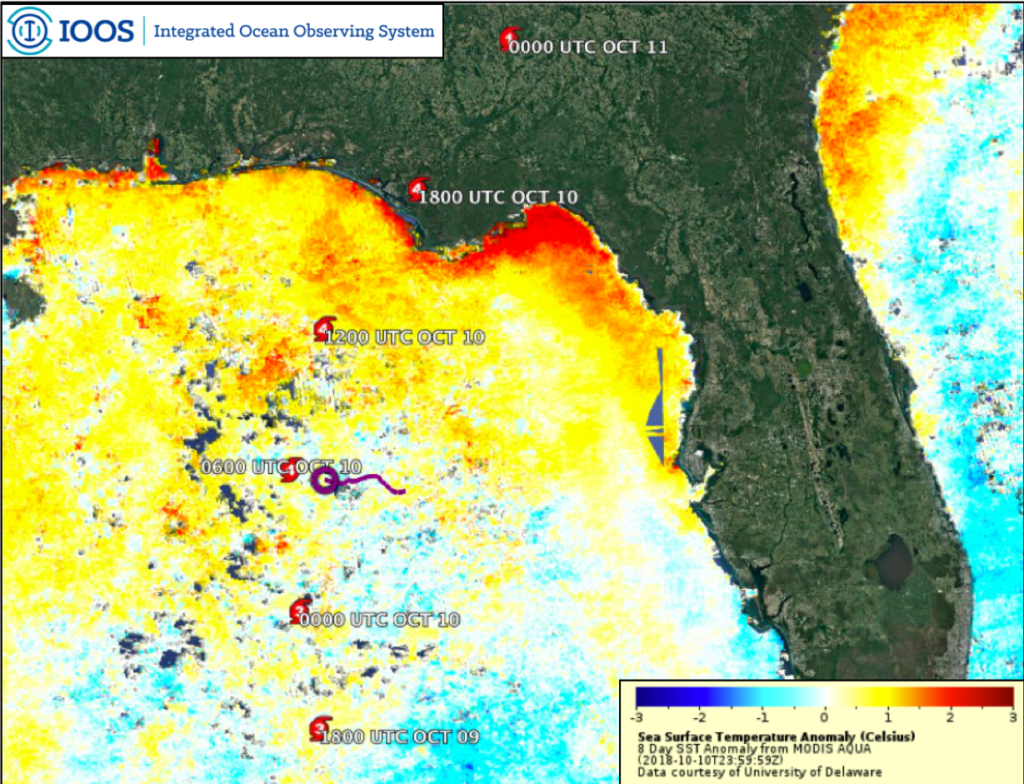
Micahel is now making its way through the Carolinas and into the Northeastern part of the country. It looks like it had a truly devastating impact of the Florida panhandle region coming ashore as a category 4, a few miles per hour shy of a category 5. Some of the rapid intensification is likely due to warm sea surface temperatures in the Gulf of Mexico. Above is a plot of the 8-day composite sea surface temperature anomaly after removal of the 15 year average for the same time period. This product is generated by the University of Delaware Ocean Remote sensing and Biogeography (ORB) Lab. Above average temperatures are clearly visible in the northern portion of the Gulf where the storm intensified.
Additionally, this image shows a glider track in purple for the US Navy Glider NG288, which we’ve been following for the past few blog posts. The system collected data throughout the storm, transmitted it to shore where the Navy made it available to IOOS for public release.
In the time and depth slice from NG288 it’s clear that surface layer was very warm, exceeding 28 Celsius down to about 50 meters ahead of the storm.This thick warm surface layer provided an ample pool of heat to maintain and intensify Michael as it approached land. On October 10th, as the storm passed over the glider location there is rapid mixing and deepening of the surface mixed layer from 50 meters down to almost 100 meters, but with very limited ocean cooling. This is an exciting dataset that we’ll be using for years to come to understand rapid intensification of hurricanes in the Gulf of Mexico.
-
Hurricane Michael cloud tops
Posted on October 10th, 2018 No comments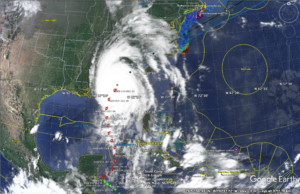
Above is our usual cloud top image showing the size of Hurricane Michael after making landfall today in Florida. Michael is forecast to take an inland route across the southeast states and cross the Mid Atlantic Bight on its way back out to sea.
-
Hurricane Michael glider model comparisons for October 9th
Posted on October 10th, 2018 No comments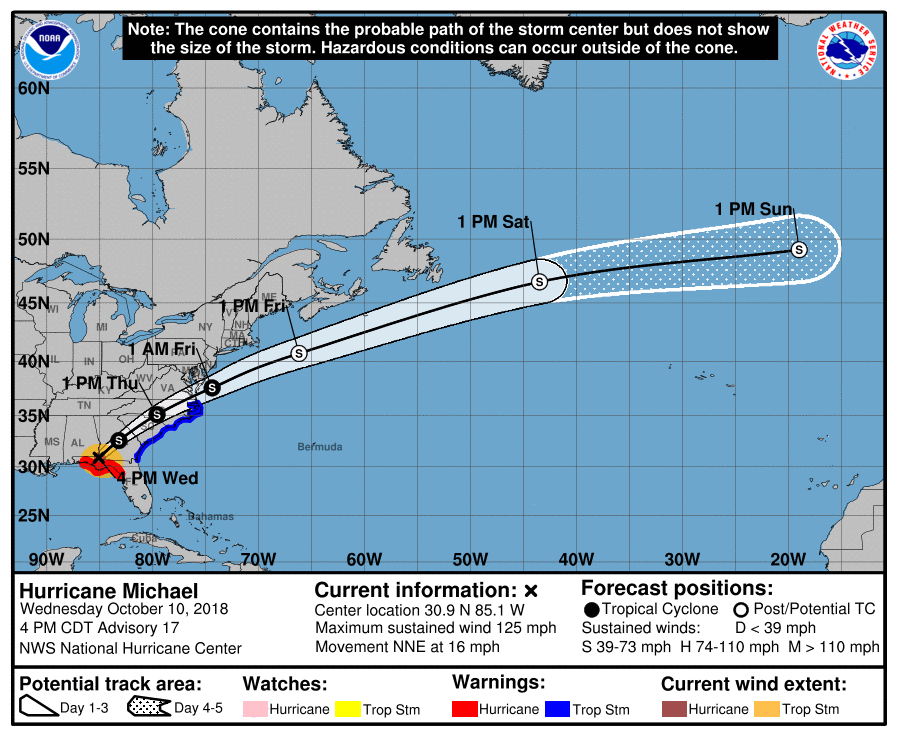
According to the National Hurricane Center Michael has made landfall in Florida as a Category 4 Hurricane with winds just below Category 5 levels.
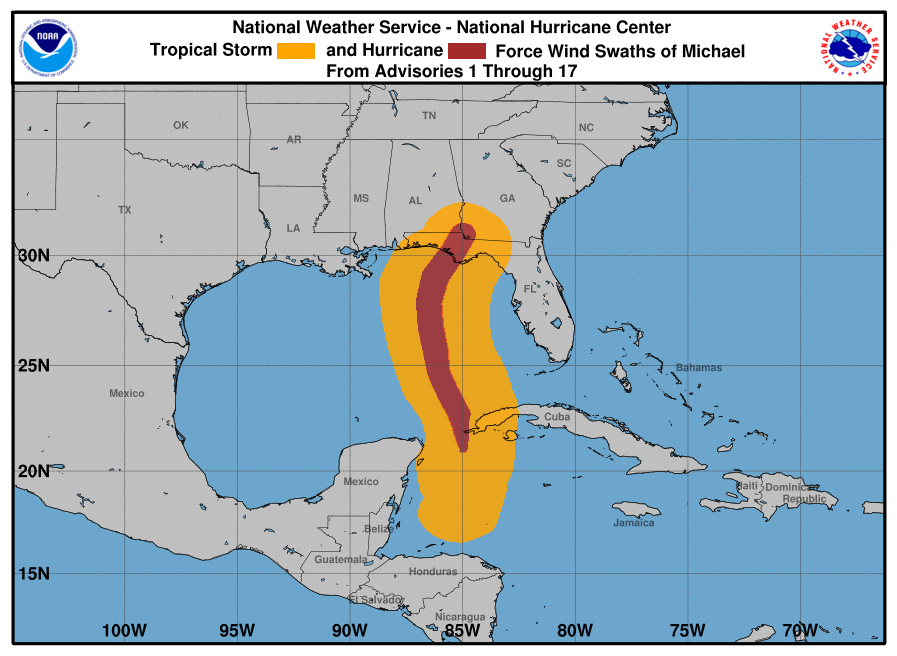
There’s an approximately 500 km wide swath of hurricane and tropical storm force winds across the eastern Gulf of Mexico.
Just prior to landfall, the storm’s eye passed within about 50 kilometers of Navy Glider NG288’s most recent reported location.
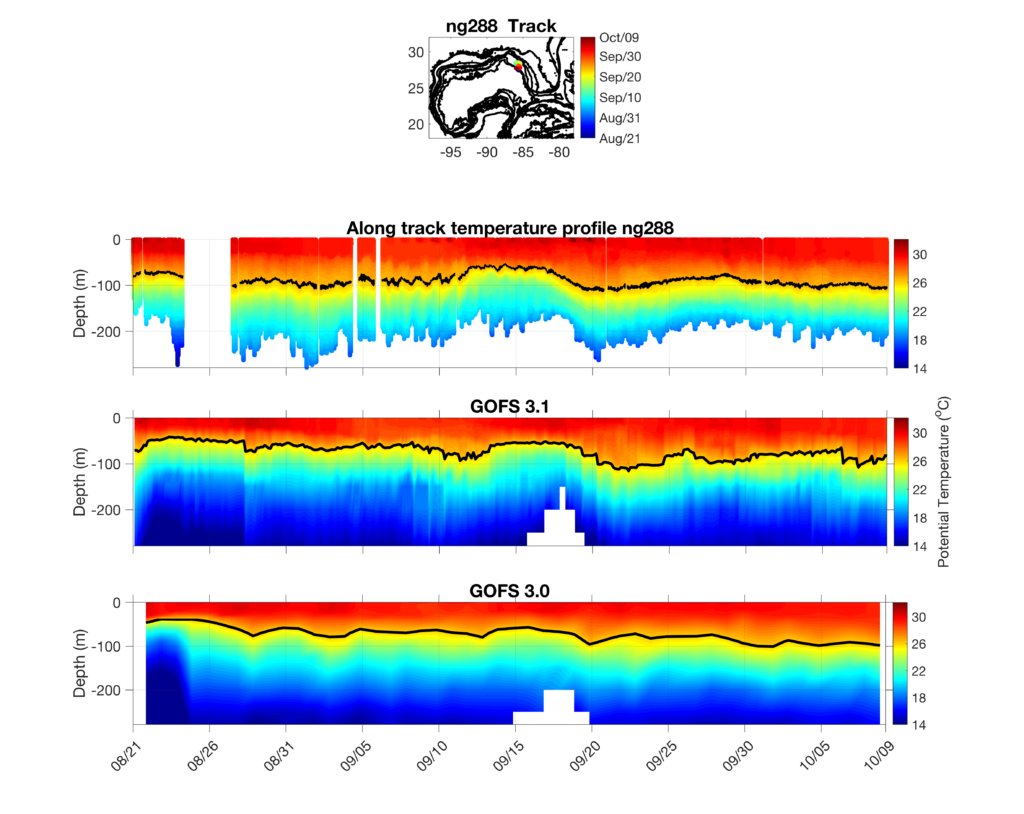
Above are Cross-sections of temperature from (top) Glider NG288, (middle) the Navy HYCOM Global Ocean Forecasting System 3.1, and (bottom) Navy HYCOM Global Ocean Forecasting System 3.0 run by the Navy Research Laboratory. The black contour shows the position of the 26 degrees Celsius isotherm, which is commonly used to calculate ocean heat content for hurricane intensity purposes.
At a glance the models have similar surface temperatures to the glider observations throughout the deployment, but the 26 degree Celsius isotherm in both GOFS 3.0 and 3.1 appear to be slightly shallower than the observed position.
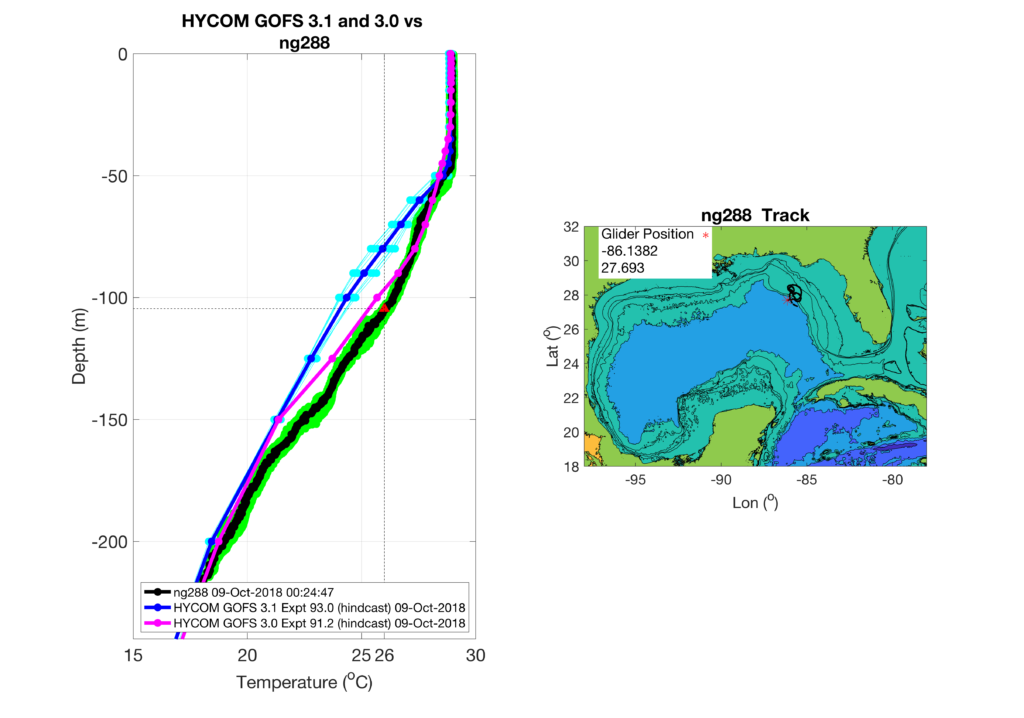
Next we zoom in to the last days profile comparisons before Michaels passage. The lines and colors are defined as in the previous post, but now we’ve added a vertical line and red triangle indicating the 26 degree Celisus temperature its depth in the glider observations. The depth of the mixed layer at 50 meters is well represented by GOFS 3.1, while GOFS 3.0 does a better job of matching the observed temperature profiles below the mixed layer.
-
Navy Glider Model Comparisons for Hurricane Michael
Posted on October 8th, 2018 No comments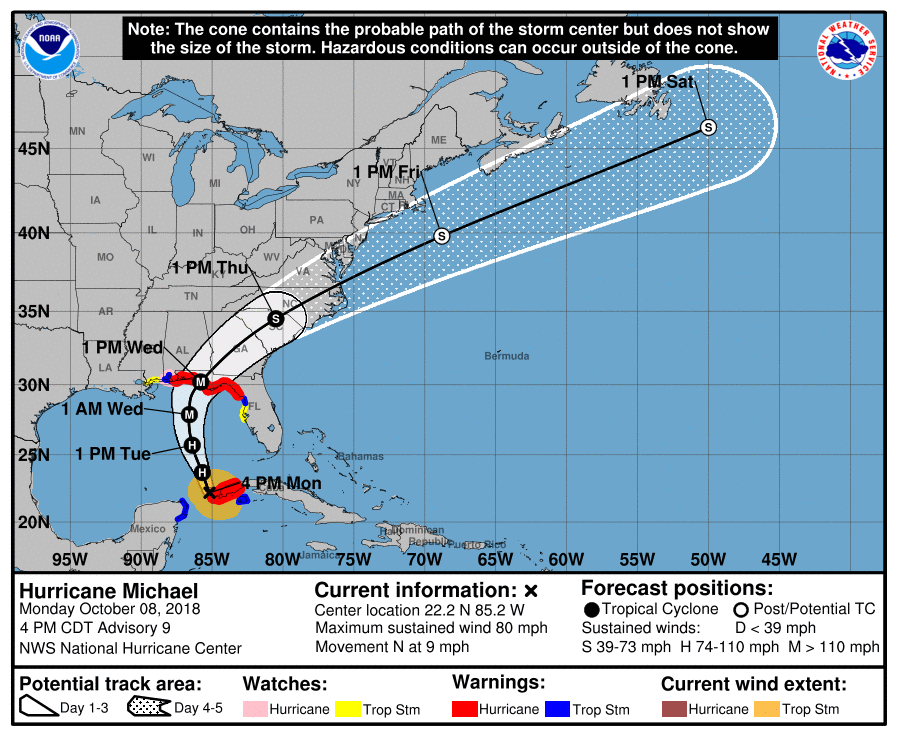
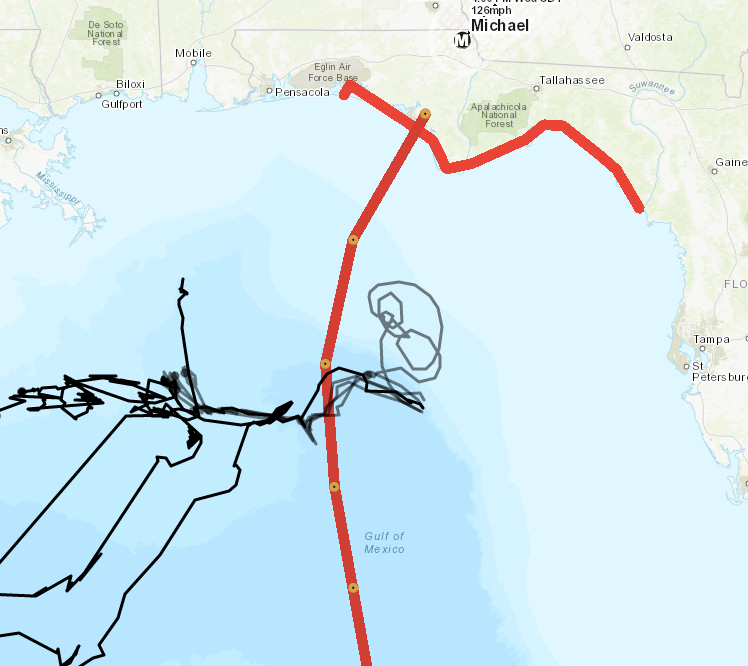
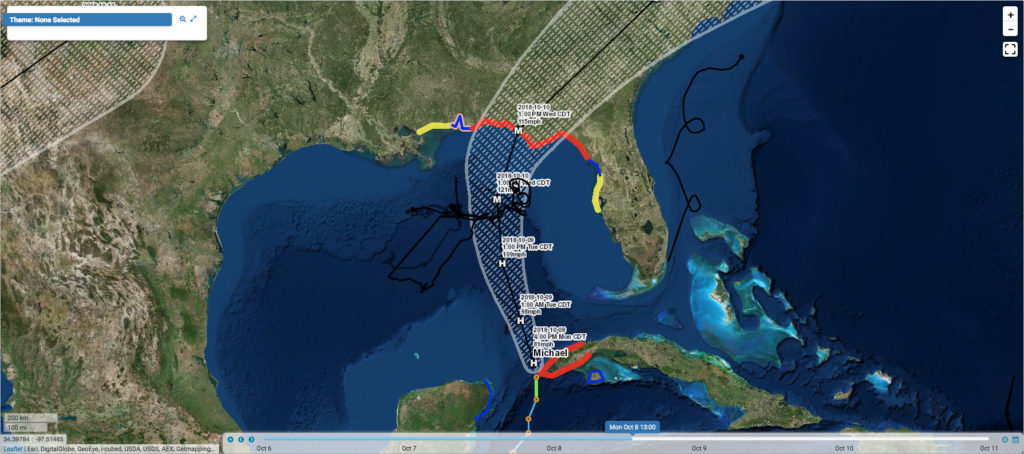
The Atlantic Hurricane season is not over yet. Hurricane Michael has recently spun up in the Caribbean Sea and is making its way into the Gulf of Mexico. There are still a number of gliders in the east coast, Caribbean, and Gulf of Mexico picket line out there. Navy Glider NG288 is positioned just to the right of Michael’s predicted track, where winds, waves, and ocean mixing are likely to be the highest. A plot of the NHC storm track and glider track (in black) is shown below from the MARACOOS Oceansmap Data Portal
Maria, our IOOS research analyst, has generated the usual glider data/model comparison profiles for the last day from Navy HYCOM GOFS 3.0 and 3.1.
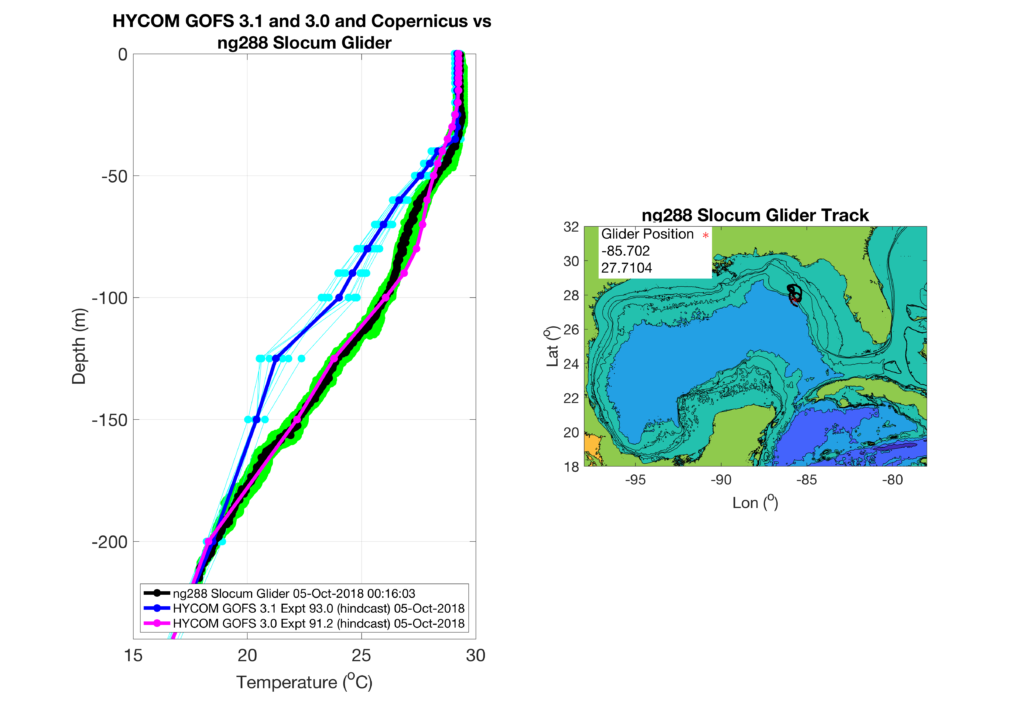
In the left panel: individual glider data profiles are shown in green with the daily mean in black, GOFS 3.0 only archives daily and is plotted in magenta, and GOFS 3.1 profiles are every 3 hours and plotted in light blue with the daily average in dark blue. In the upper 30 meters both GOFS 3.0 and 3.1 are in good agreement with glider observations with temperatures all near 29 Celsius. Below 30 meters depth the models diverge, with GOFS 3.0 following the glider profiles closely throughout the water column. GOFS 3.1 remains a few degrees cooler than the glider and 3.0 until about 200 meters depth. The heat content, defined as the depth integrated heat above the 26 degree isotherm, for GOFS 3.1 is going to be lower than the glider or GOFS 3.0.
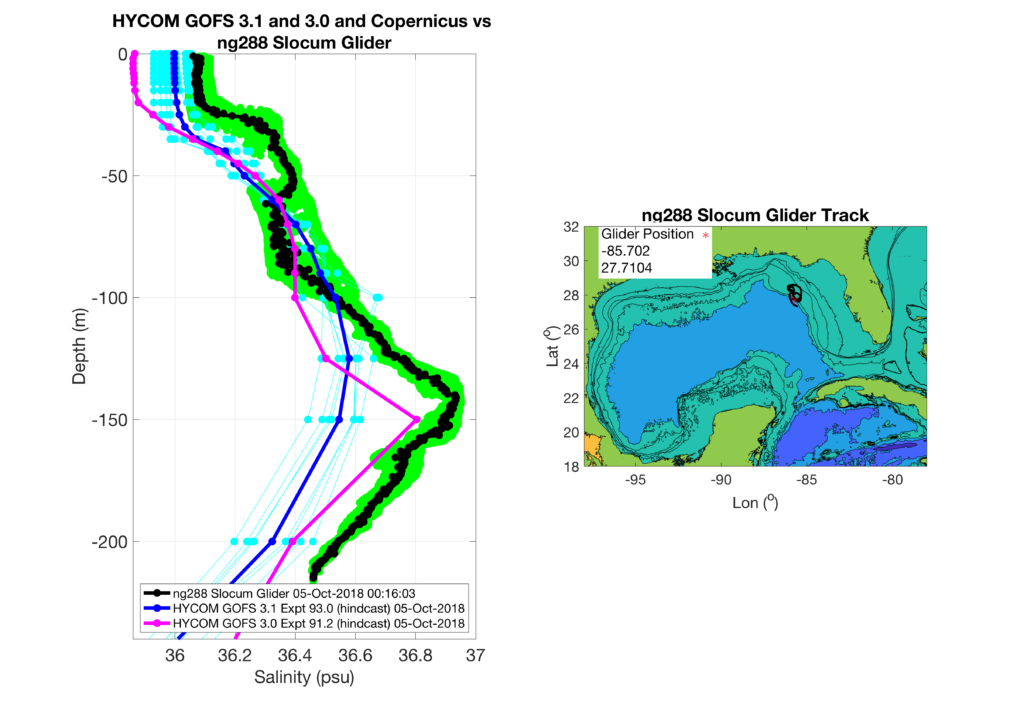
Both models are fresher than the observed salinity profiles throughout the water column, with GOFS 3.1 being closer to observations in the surface, and GOFS 3.0 closer near the salinity maximum at ~150 meters depth.
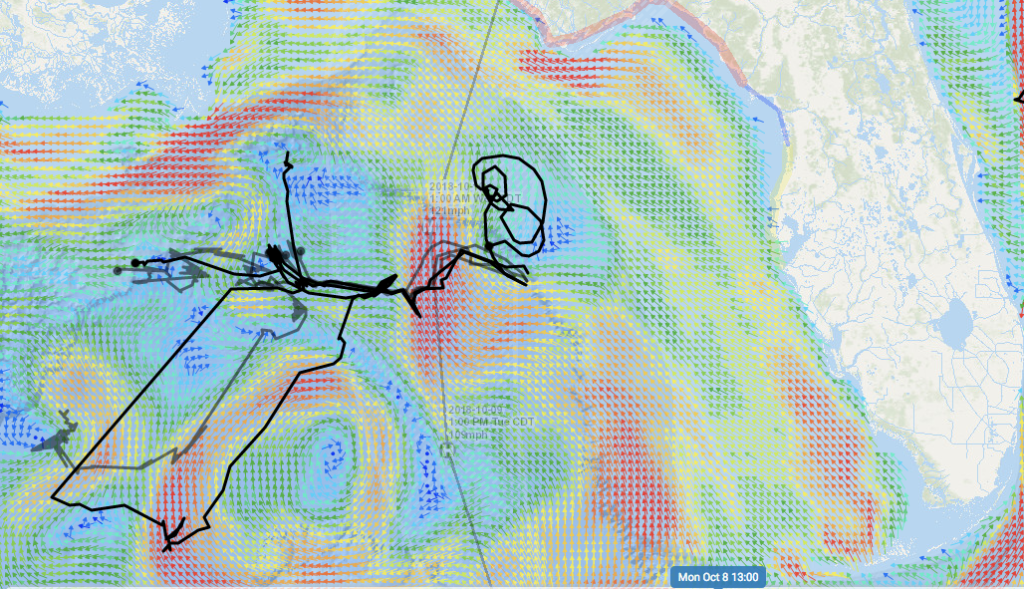
A snapshot of surface currents from Navy HYCOM in MARACOOS Oceansmap shows that a warm core loop current eddy is located just to the west of the storms predicted position at 1:00 PM CDT Tuesday October 9th. The glider is located in a frontal region near the storms predicted position at 1:00 AM CDT Wednesday October 10th, with slow currents to its east and fast northward currents to its west. The uncertainty in model data comparisons may be related to the placement of these features in the different models, and will require further investigation.
-
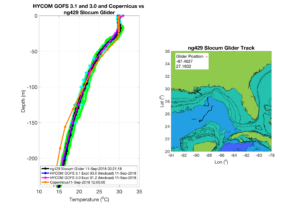
Sept 11 Sentinel Glider Tour
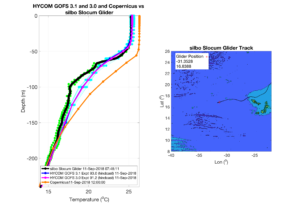
Posted on September 14th, 2018 No commentsA first tour of the Hurricane Sentinel Glider Fleet on Sept 11 as Florence was still approaching and a comparison to the operational models. Note that the data was transmitted over the GTS so it was available for assimilation in the models. All plots were prepared by Maria Aristizabal.
The first picket line is off Africa in the formation zone where the north-south extent is relatively narrow.
TWR Glider SILBO indicates the GOFS models are getting the surface layer quite well. All models miss the colder temperature layer near 100 m, but all are back in good agreement between 150 and 200 m.
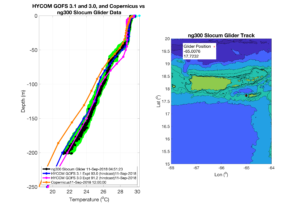
Second picket line. The Caribbean and Tropical Atlantic.
First is the station keeping Navy Glider NG300. GOFS models doing well, especially GOFS 3.1
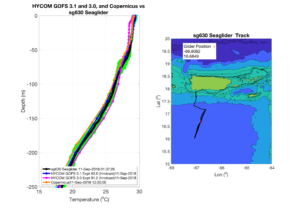
Next is the AOML Glider SG630 occupying the transect south of PR. All models agree well.
Then the third picket line protecting the US Mainland.
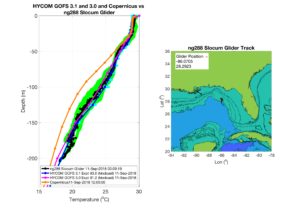
Gulf of Mexico first.
Navy Glider NG429 is in deepwater. GOFS models do well in deepwater.
Navy Glider NG288 is on the outer shelf. Not only do GOFS models do well, GOFS 3.1 even matches some of the curves in the profile. Data assimilation might be doing very well here.
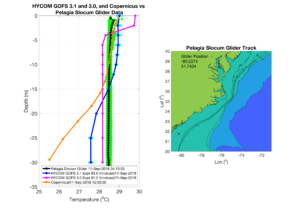
Now South Atlantic Bight
Skidaway Institute of Oceanography glider PELAGIA. We have told this story before. GOFS 3.0 is closest, but it might be for the wrong reasons. GOFS 3.1 is designed to have more vertical resolution in shallow water, and PELAGIA is definitely in shallow water.
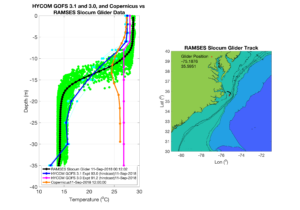
Into the Mid Atlantic Bight.
Here is RAMSES, the UNC glider operated by SIO for the NSF PEACH program. An early favorite in the reporting. Here is where GOFS 3.1 shines bright even in shallow water.
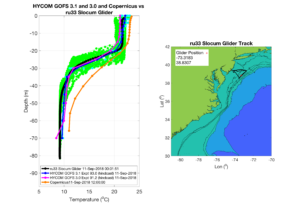
Moving north, we find Rutgers glider RU33 running along the shelf break. We are on the deeper side of the shelf. The Stratification Factor maps showed that both GOFS 3.0 and 3.1 were stratified on the outer shelf, and that is what this comparison demonstrates.
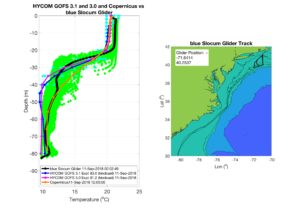
Continuing north to UMass Glider BLUE, we see a complicated structure at mid shelf that no model likes. Copernicus seems to lock onto the profile sooner, near 40 m.
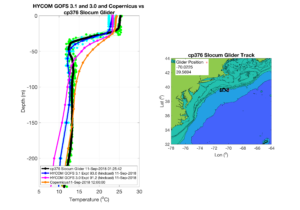
One final step north, we move on to the NSF OOI Coastal Pioneer Glider CP376. Another profile that no model seems to like, even with this glider in deepwater. Surface temperatures are off. GOFS 3.1 is good at getting the near surface variation. Copernicus is good at getting the deep variation.
-
Isothermal shelf waters and Florence
Posted on September 14th, 2018 No commentsFlorence is approaching Wilmington NC as a category 1 storm according to the National Hurricane Center https://www.nhc.noaa.gov/text/refresh/MIATCDAT1+shtml/140842.shtml
It’s slowed down significantly and is still sitting over warm coastal ocean waters. Glider data profiles from RAMSES to the north of Florence and PELAGIA to the south of Florence in previous posts have shown that the continental shelf of the South Atlantic Bight is isothermal, or uniformly warm from top to bottom. Additionally, with the approach angle of Florence winds look to be downwelling favorable meaning that any cold bottom water on the outer shelf was or is likely being advected offshore, while warm surface water is potentially being advected onshore.
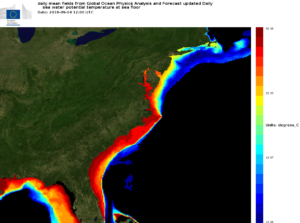
This means that despite vigorous mixing in the coastal ocean there is not likely to be any ocean cooling on the shelf, as there simply isn’t any cold water available to mix to the surface. Bottom temperatures from the European Mercator model show warm bottom temperatures across the entire SAB in contrast to the cold bottom temperatures in the MAB.
Florence has been a slow moving storm over the continental shelf and with little ocean cooling these warm waters will likely not help weaken the storm.
A new batch of glider profiles are coming in this morning to confirm this, but overall this highlights the large differences in regional coastal ocean water masses and highlights processes that we’ll want to investigate in the coming years to better understand how coastal oceans affect storm intensity ahead of landfall.
