-
TS Arthur tracks along the Gulf Stream
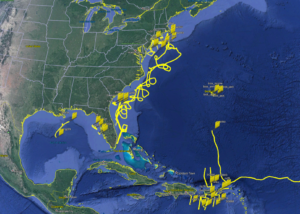
Posted on May 19th, 2020 No commentsBelow is the view of Tropical Storm Arthur in the MARACOOS OceansMap. https://oceansmap.maracoos.org/
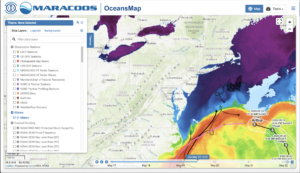
The track of Arthur follows the warm water of the Gulf Stream observed in the satellite SST. Arthur is forecast to now turn more towards the south. Arthur tracked close to 2 gliders that were flying in the Gulf Stream, Silbo operated by TWR and a spray glider operated by WHOI. Silbo in black is shown leaving the Gulf Stream to the north while the Spray glider in gray continues west with the Stream. Currents from the MARACOOS HF Radar network on the Mid Atlantic shelf are strong and alongshore towards the south.

A quick look at the global model temperature profiles as Glider Silbo leaves the Gulf Stream looks like a much faster departure in the models than in the real world. We’ll look more at the slope sea comparison when the glider is out of the Stream in both the model and real world conditions. Plots from all the gliders can be viewed at https://rucool.marine.rutgers.edu/hurricane/Hurricane_season_2020/
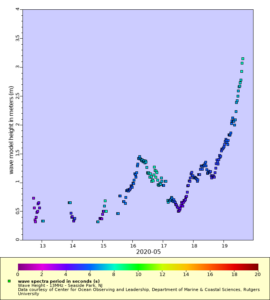
NHC warnings included heavy surf along the Mid Atlantic coast from Arthur. Some of the HF Radar systems in the Mid Atlantic are set up to monitor waves in real time and send the data to the NWS forecast offices. Above is one example of HF Radar derived waves along the NJ coast at Seaside Park, the first site to break 3 m. Waves from the NDBC sites further offshore are approaching 9 ft. The full HF Radar waves dataset can be accessed at
https://marine.rutgers.edu/~hroarty/maracoos/ERDDAP_MAB_HFR_Wave_Data_v2.html
-
TS Arthur forecast to turn just south of the gliders
Posted on May 18th, 2020 No comments
Tropical Storm Arthur is forecast to move parallel to the North Carolina coast today. The morning forecast discussion from the National Hurricane Center indicates that “Arthur is moving near and almost parallel to the Gulf Stream”. Several gliders are deployed in the slope sea or Gulf Stream just north of the forecast track, with glider Silbo being in the most southern position.

In the above figure temperature profiles from the global models are compared to glider Silbo. Profiles from the U.S. data assimilative GOFS and the operational RTOFS have similar features and agree well above 400 m and below 800 m. The transition between the 18C water near 300 m depth and the 7C water near 800 m depth is often related to differences in the position of the Gulf Stream. The global model from Copernicus starts near the same surface temperature, likely due to similar satellite Sea Surface Temperatures being assimilated, and is similar in the deep water at 1000 m, but what happens in between is has a very different shape.
-
New 2020 Ocean Forecast Workflow for Hurricanes
Posted on May 15th, 2020 No comments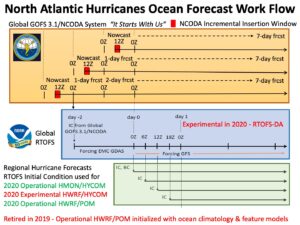
There are 3 steps in the workflow for the ocean component of NOAA’s operational hurricane forecast models HMON and HWRF.
Step 1 is data assimilation. This is accomplished by the Navy using the Global Ocean Forecast System (GOFS) version 3.1. The data is assimilated using the Navy Couple Ocean Data Assimilation (NCODA) system. Data from each day is typically inserted over a 3 hour insertion window running from 9Z to 12Z each day. Major datasets for assimilation include satellite Sea Surface Temperature (SST), satellite sea surface height from altimeters, data from profiling instruments like Argo and underwater gliders, etc.
Step 2 is to layer on the NOAA global windfield from GFS. Here the NOAA global Real Time Ocean Forecast System (RTOFS), starting at day 0, looks back 2 days and extracts from GOFS 3.1 its initial condition (IC). That initial condition is then run forward back up to day 0 without data assimilation with forcing from the EMC GDAS. Then on day 0, the wind forcing is switch to GFS to run RTOFS for several days into the future. Starting in August 2020, it is anticipated that and experimental version of RTOFS Data Assimilation (RTOFS-DA) will be run. Thus there are 3 US global ocean models to compare to observations this coming hurricane season – operational GOFS3.1 with NCODA, operational ROTFS without data assimilation, and experimental RTOFS with RTOFS-DA. We hope to expand this to include the European global ocean forecast system available through Copernicus.
Step 3 is to extract initial conditions (IC) and Boundary Conditions (BC) from RTOFS every 6 hours to initialize the regional ocean models that are coupled to the atmospheric forecast models HMON and HWRF. The operational HMON atmospheric model is coupled to a regional HYCOM ocean model. The HWRF atmospheric model is coupled to both HYCOM and POM ocean models. It is anticipated that for the 2020 hurricane season, the operational HWRF will be coupled to POM, and an experimental HWRF will be coupled to HYCOM. This makes at least 3 different oceans that will be present under hurricanes this season. The commonality in 2020 is that all 3 oceans will start from the same initial condition provided by ROTFS every 6 hours. The difference will be what ocean model and what windfield is used to evolve the initial conditions, and how much difference that makes during the storm forecast.
-
Navy Gliders View the Cold Pool
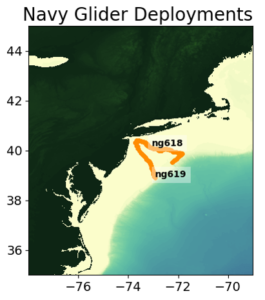
Posted on October 25th, 2019 No commentsTwo Navy gliders were deployed in the Middle Atlantic Bight (MAB) between September 11 & 26, 2019. Their cross-shore trajectories were planned to capture the cold pool, a cold bottom layer of water that characterizes the MAB at this time of the year. There transects are shown below.
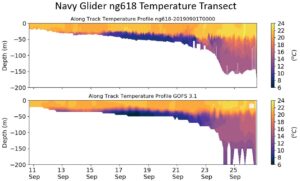
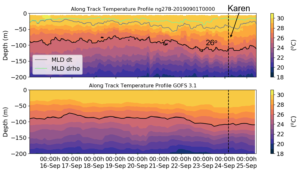
In the figures below, the top figure shows the cross-shore temperature transect for glider ng618. In this figure the cold pool can be identified as the bottom water with temperature less than 10 degrees Celsius. The cold pool has important implications for the fisheries of the region and it can become a “fire extinguisher” for tropical cyclones by lowering the sea surface temperature through vertical mixing during the passage of a storm.
The bottom figure shows the same ng618 glider trajectory from the Global Ocean Forecasting System (GOFS 3.1) that is a global operational ocean model run by the US Navy. The comparison between glider observations and the GOFS model are remarkably good.
-
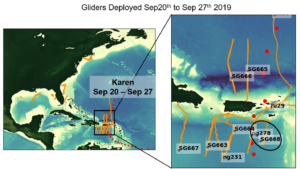
Low Surface Salinity During Tropical Storm Karen
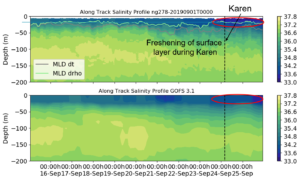
Posted on October 3rd, 2019 No commentsDuring Tropical Storm Karen, there were 10 gliders deployed in the Caribbean (below). On Sep 24, the eye Karen passed over Navy glider NG278, just south of St. Croix.
There is a good agreement in the vertical structure of temperature between GOFS 3.1 and the glider temperature (below).
The GOFS 3.1 model, however, has a surface fresh layer (barrier layer) that is not as sharp as the observations show. This barrier layer gets even fresher and shallower during Karen (below). At the moment we are investigating if this freshening can be attributed to increased precipitation during the storm. If this is the case, this can be a mechanism that reinforces stratification during a storm and inhibits vertical mixing. We would like to investigate how important this possible mechanism is in controlling the storm intensity.
The freshening that happened during Karen (Sep 23 – Sep 24) is not initially captured by any of the models (below).
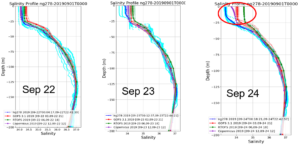
By Sep 26, the surface salinity in GOFS and Copernicus were much closer to the observations (both models assimilate data) but RTOFS still lags behind (below).

Images of these daily comparisons, since the inception of the 2019 hurricane season, are available here.
-
There are a lot of gliders out there!
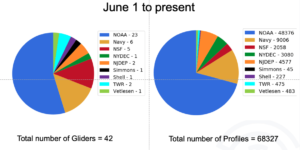
Posted on October 1st, 2019 No commentsThe 2019 hurricane season is in full swing in the Atlantic Ocean. Since the inception of the hurricane season on June 1, 42 ocean gliders have been deployed in the western Atlantic ocean by numerous academic, corporate and government partners. These gliders have acquired over 68,000 profiles of temperature and salinity to date. Some gliders also record data on water optics, oxygen, current speeds, pH, and wave heights. A distribution of the groups funding the deployments is shown below as well as a map of their locations.
-
Salinity Adjustment Ahead of Hurricane Dorian
Posted on September 27th, 2019 No commentsAccurate ocean initial conditions in numerical models are necessary to improve hurricane intensity forecasts (see article). One way to improve the initial conditions in operational ocean models is to use data assimilation, a technique that allows a numerical model to ingest observational data to nudge the model predictions closer to reality. The goal of the comparisons is to evaluate how data assimilation is impacting the model performance and ultimately how ocean processes affect storm intensity. Images of these daily comparisons, since the inception of the 2019 hurricane season, are available here.
For the daily comparisons we use three operational ocean models: Global Ocean Forecasting System (GOFS 3.1, Navy), Real Time Ocean Forecasting System (RTOFS, NOAA) and the operational Mercator global ocean analysis and forecast system (Copernicus).
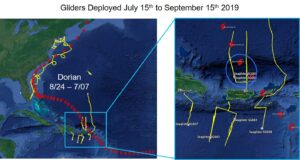
During Hurricane Dorian there were a total of seven gliders deployed in the Caribbean reporting to the IOOS glider data assembly center (IOOS Glider DAC). Once the gliders start reporting data to the IOOS glider DAC, the data is sent to the Global Telecommunication System (GTS) where it can be assimilated by ocean models.
On August 29, Tropical Storm Dorian passed over three gliders: SG665, SG666 and SG668 (Figure 1).
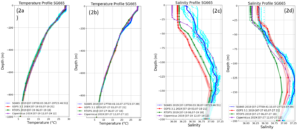
Figures 2a-2d below highlight the comparisons of the models to glider SG665. In general, the operational ocean models capture the temperature structure in the Caribbean (Fig. 2a and 2b), however, in this example, the models tend to underestimate salinity at the surface and subsurface salinity maximum around 200 meters in this area. The assimilation of glider data into operational ocean models plays a very important role in correcting the subsurface and surface salinity structure. An example of this correction is highlighted in figures c and d. GOFS 3.1 (red line) is shown in figure c on the first full day of the glider deployment. Figure d shows a shift of 0.4 psu after a week of assimilation, pushing GOFS 3.1 much closer to the reality of the salinity structure.
-
International Challenger RU29 Mission Update
Posted on September 12th, 2019 No commentsRU29 is tuning up to measure currents: RU29 spent the day profiling in about 1000 m depths off Virgin Gorda, with operators tweaking settings on the onboard Doppler current velocity profiler to optimize its ability to measure ocean currents. An important aspect of the mission will be measuring speed and direction of currents below the surface to determine the movement of the water masses distinguished by their temperature and salinity characteristics.
Currents in the region can be strong and have complex patterns. The figure below shows the modeled (US Navy AMSEAS model) currents in the region for 11 September, 2019. RU29 is in an area of northward surface currents greater than 1 knot. Ocean gliders themselves are only capable of forward speeds of around 0.5 knots, and only when they are ascending or descending. In order to make headway, they depend on spending most of their time well below the surface, where the currents are generally slower. If necessary, the glider does have a small electric motor and propeller which it can use, but at the cost of tapping into its limited battery reserves.
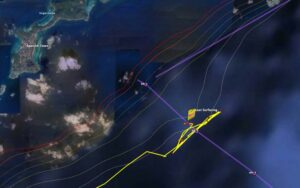
RU29 recent trackline and position on 11 September 2019. The glider should begin its trip across the Anegada Passage station line on 12 September.
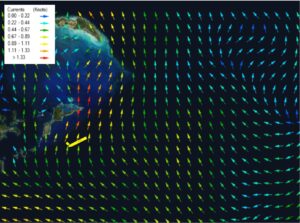
Modeled surface current vectors from the US Navy AMSEAS model from 2100 UTC, 11 September, 2019. From OCEANSMAP Caribbean.
To see all of the current reports, you can view them here: http://ocovi.azurewebsites.net/resource/Ru29
The International Challenger RU29 Mission is a collaboration among Rutgers University (New Brunswick, NJ) Center for Ocean Observing Leadership, Ocean and Coastal Observing – Virgin Islands (OCOVI, an affiliate of the US Integrated Ocean Observing System (IOOS) Caribbean Coastal and Ocean Observing System (CARICOOS)), and the University of the Virgin Islands. This mission will collect upper ocean data to improve hurricane forecasting models; study conditions in the Anegada Passage, an important region for NE Caribbean climate change; and build international cooperation for ocean observing and glider activities. The mission will work in the waters of the US Virgin Islands, British Virgin Islands, and Anguilla, under international Marine Science Research permit . Funding for the project comes from the U.S. National Oceanic and Atmosheric Adminstration through the IOOS, Rutgers University, and the G. Unger Vetlesen Foundation.
-
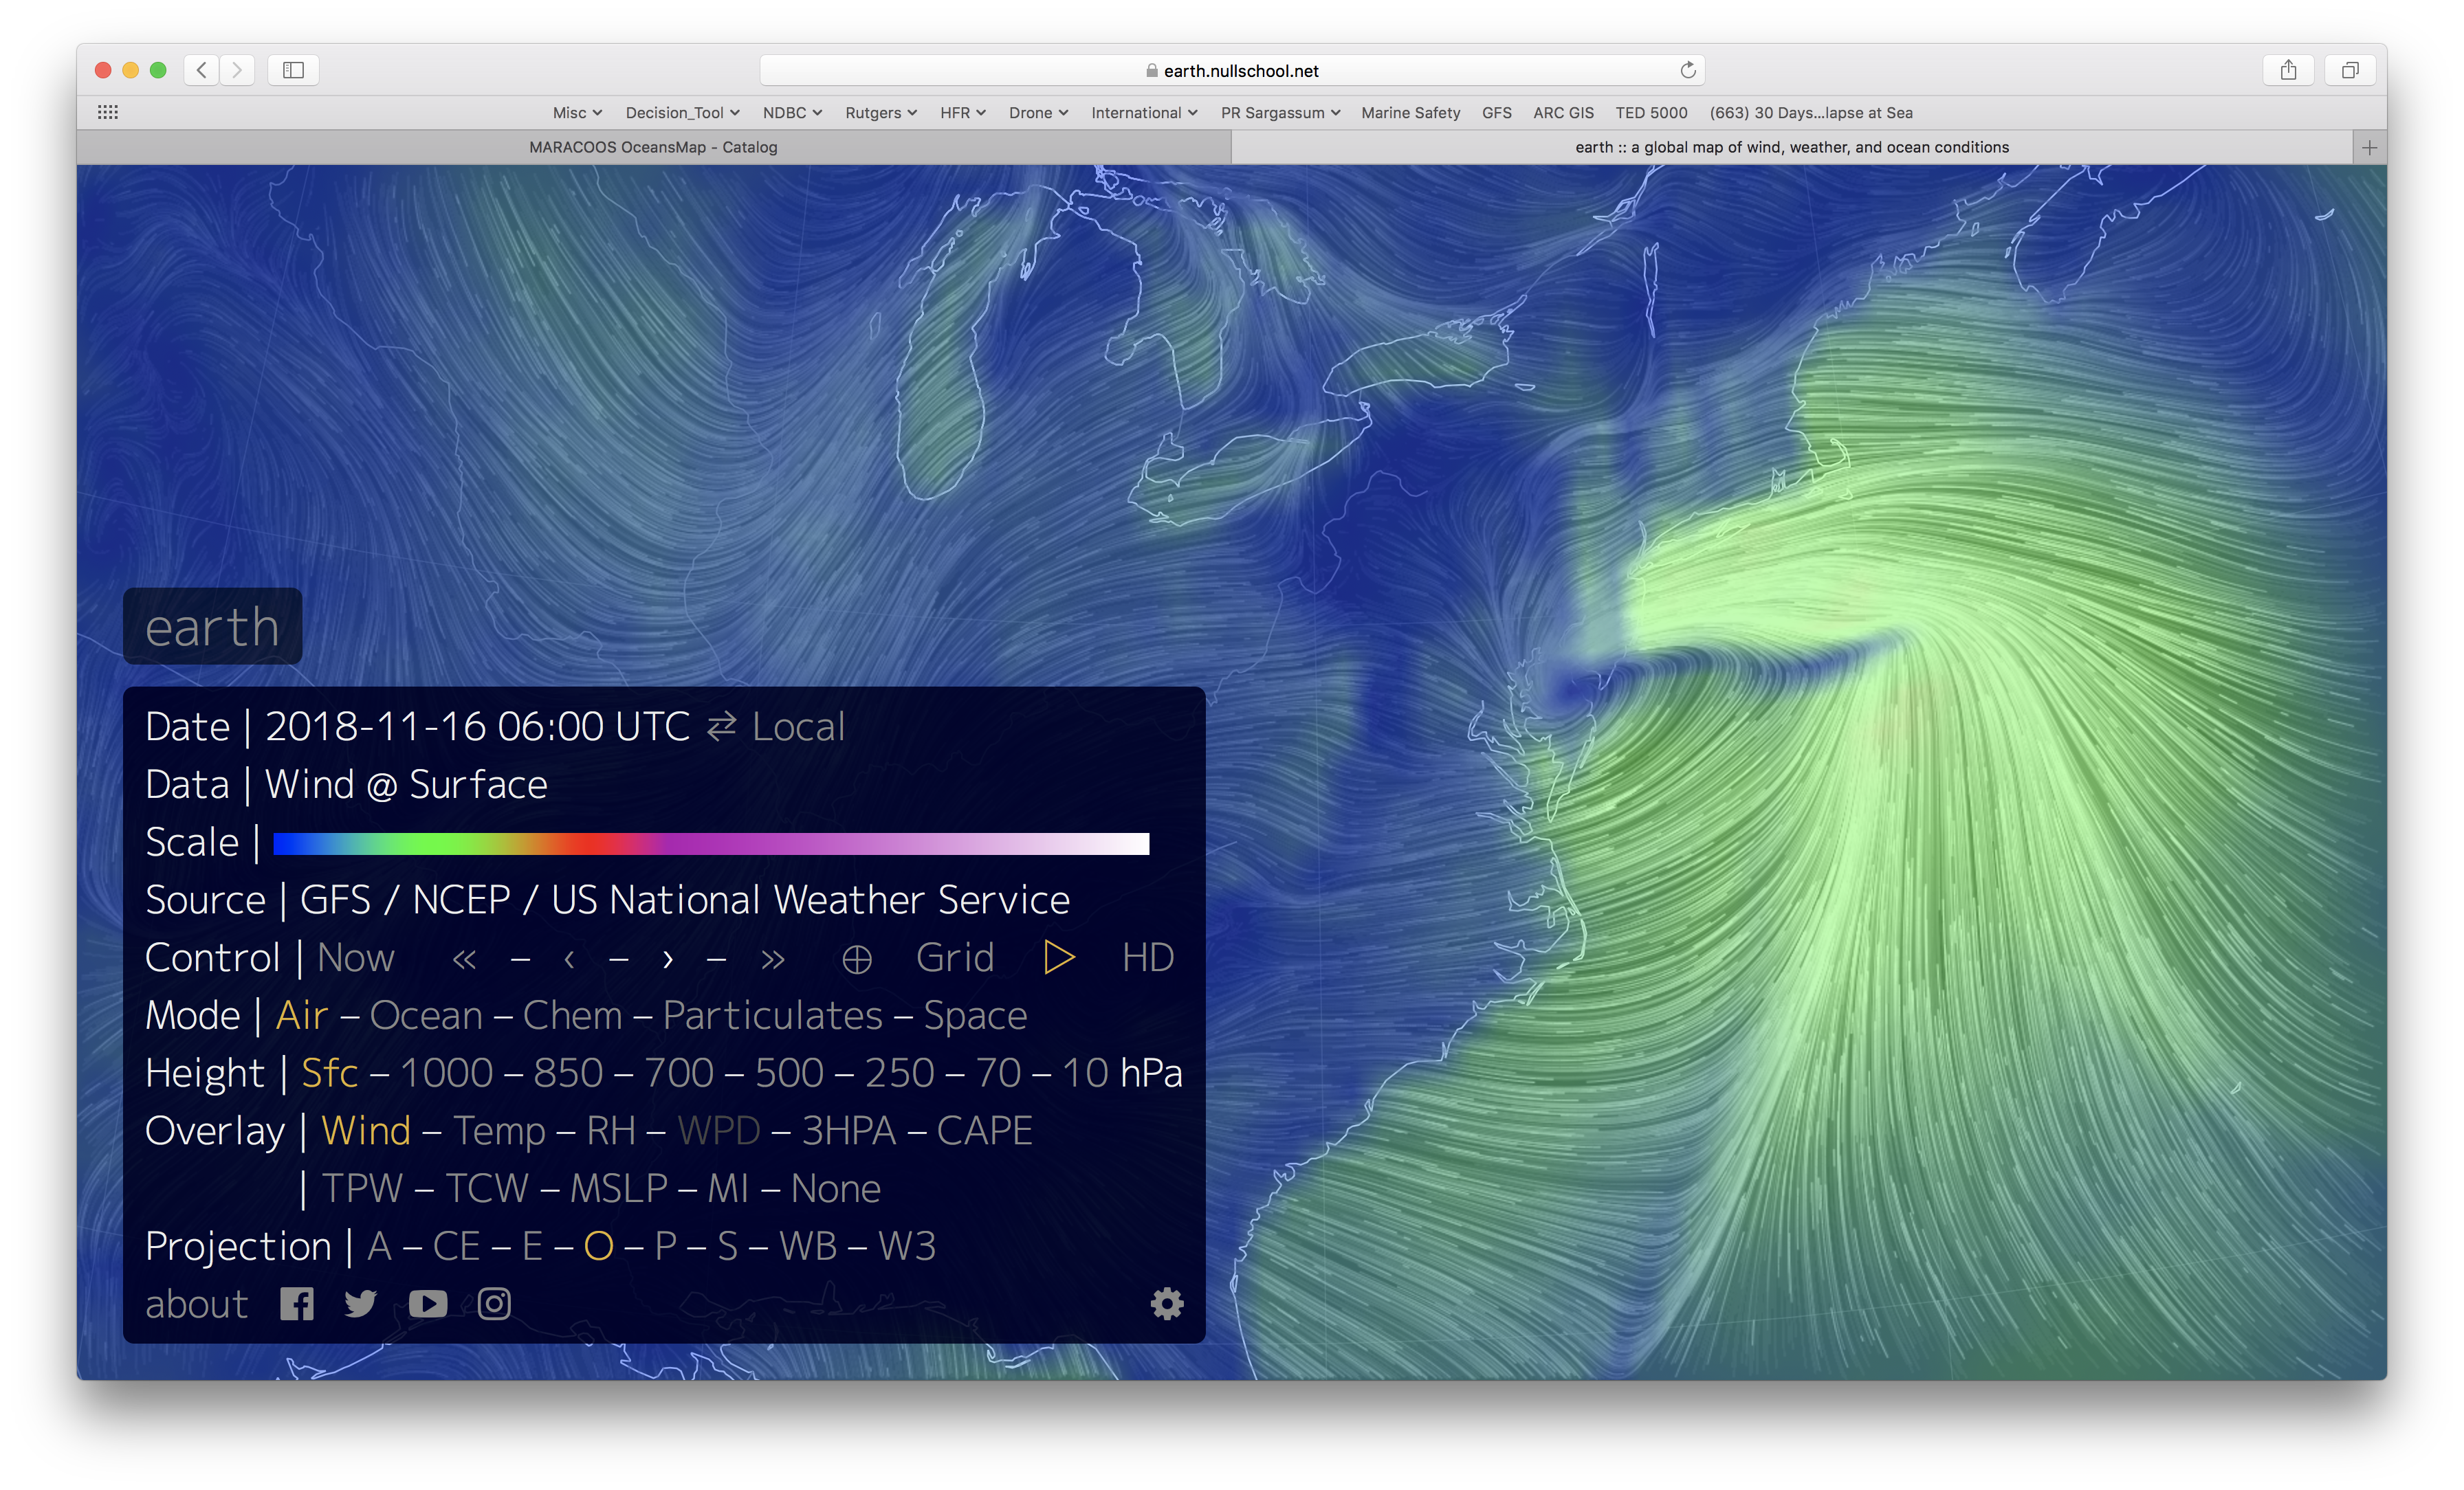
Ocean Response to Winter Storm
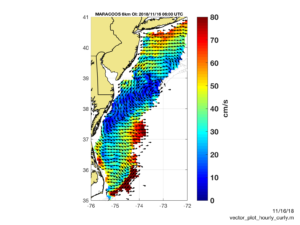
Posted on November 16th, 2018 No commentsA storm moved through the Mid Atlantic on November 15, 2018. The MARACOOS High Frequency radar network captured the center of the low pressure system as it moved north past Delaware and New Jersey.
The surface winds from the Global Forecast System (GFS) had the center of the low further inshore.
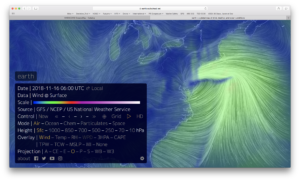
We’ll continue to analyze these two data sets to understand the discrepancy.
-
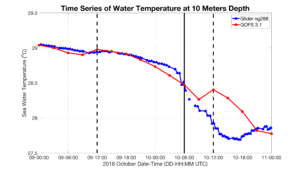
Rapid near surface temperature change in Michael
Posted on October 18th, 2018 No commentsHere is a comparison of the temperature in the upper mixed layer (10 m depth and 20 m depth) at the location of Navy Glider 288. Hurricane Michael passed within less than 50 km of ng288. The swath of tropical wind scale winds was about 500 km wide, so this was relatively close to the track of the hurricane. And the glider was on the right had side of the track, so perfectly placed in the most intense winds.
Solid black vertical line is time of hurricane eye passage over Navy Glider 288. Dashed black vertical lines are data assimilation times.
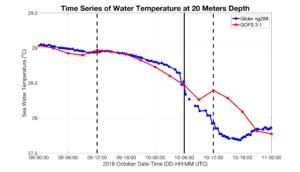
The agreement between the surface layer temperature observed by ng288 and the GOFS 3.1 forecast is remarkable. The model even appears to be cooling the surface layer at the proper rate. Note that most of the observed cooling occurs after eye passage, the opposite of what we see in the Mid Atlantic.
The dashed line at 1200 on Oct 10 will be an interesting case to study with our colleagues. We assume the glider data is being assimilated, our friends at NRL are good at checking for this. During this time of rapid temperature change, if glider data from earlier in the day is assumed to apply at noon on Oct 10, it will try to increase the temperature as we observe here. The model then appears to cool the temperature at the right rate despite being incorrectly offset boy about 0.5C.
Establishing what happened through the data assimilation during the passage of Michael over ng288 will be a great research question for us to prusue over the winter as we prepare for the 2019 hurricane season.