


-
Salinity Adjustment Ahead of Hurricane Dorian
Posted on September 27th, 2019 No commentsAccurate ocean initial conditions in numerical models are necessary to improve hurricane intensity forecasts (see article). One way to improve the initial conditions in operational ocean models is to use data assimilation, a technique that allows a numerical model to ingest observational data to nudge the model predictions closer to reality. The goal of the comparisons is to evaluate how data assimilation is impacting the model performance and ultimately how ocean processes affect storm intensity. Images of these daily comparisons, since the inception of the 2019 hurricane season, are available here.
For the daily comparisons we use three operational ocean models: Global Ocean Forecasting System (GOFS 3.1, Navy), Real Time Ocean Forecasting System (RTOFS, NOAA) and the operational Mercator global ocean analysis and forecast system (Copernicus).
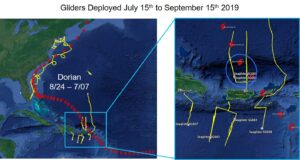
During Hurricane Dorian there were a total of seven gliders deployed in the Caribbean reporting to the IOOS glider data assembly center (IOOS Glider DAC). Once the gliders start reporting data to the IOOS glider DAC, the data is sent to the Global Telecommunication System (GTS) where it can be assimilated by ocean models.
On August 29, Tropical Storm Dorian passed over three gliders: SG665, SG666 and SG668 (Figure 1).
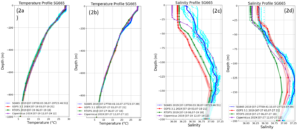
Figures 2a-2d below highlight the comparisons of the models to glider SG665. In general, the operational ocean models capture the temperature structure in the Caribbean (Fig. 2a and 2b), however, in this example, the models tend to underestimate salinity at the surface and subsurface salinity maximum around 200 meters in this area. The assimilation of glider data into operational ocean models plays a very important role in correcting the subsurface and surface salinity structure. An example of this correction is highlighted in figures c and d. GOFS 3.1 (red line) is shown in figure c on the first full day of the glider deployment. Figure d shows a shift of 0.4 psu after a week of assimilation, pushing GOFS 3.1 much closer to the reality of the salinity structure.
Last 5 posts by Mike Crowley
- RUCOOL Updates: January - April 2023 - May 5th, 2023
- RUCOOL Updates: October-December 2022 - February 1st, 2023
- RUCOOL Updates: July-September 2022 - November 17th, 2022
- RUCOOL Updates: April - June 2022 - July 19th, 2022
- RUCOOL Updates: February - March 2022 - April 26th, 2022
