


-
Two Different Oceans
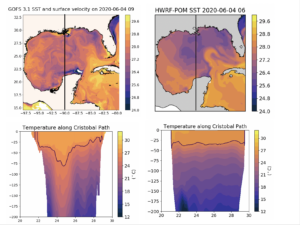
Posted on June 5th, 2020 No commentsBelow is a side by side comparison of the two oceans we have been looking at for the last 24 hours. The left hand column is the Navy’s data assimilative Global Ocean Forecast System (GOFS) 3.1. Right column is the regional-scale Princeton Ocean Model (POM) initialized using Loop Current and Eddy features models to adjust climatology. The top row is a map of the Sea Surface Temperature (SST). The black line running south to north along 90W is the approximate forecast path of TS Cristobal. Bottom row is the vertical temperature section along the 90W line between the surface and 200 m depth.
-
HWRF-POM initialized with climatology and feature models
Posted on June 5th, 2020 No commentsThe last few blogs talked about what we see in the Navy GOFS 3.1, the data assimilative step on the ocean side of the coupled atmosphere-ocean hurricane models. My blog post from May 15, 2020 describes the multi-step process that gets us to the operational models. GOFS3.1 is the data assimilation step. This information flows into Global RTOFS to layer on the NOAA global windfields. But remember, these both are global models, their job is through data assimilation and the good windfields to get the Essential Ocean Features in the right locations. We then initialize a high resolution regional ocean model capable of resolving the Essential Ocean Processes that impact hurricane intensity during the rapid co-evolution phase of the atmosphere and ocean subject to intense hurricane forcing.
Another path to the regional scale ocean model underneath the hurricane is the feature model initialization process. Here climatology is modified by typical structural models for key Essential Ocean Features. In the Gulf of Mexico, a forecaster provides 3 points to describe the location of the Loop Current, and the a model for a typical Loop Current is inserted. For the warm eddies, climatology is modified by inserting bowl shaped structures to represent the warm core.
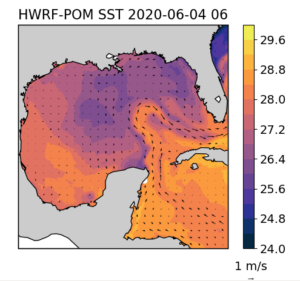
Here we investigate the results of that feature model initialization procedure used in the most recent HWRF-POM coupled forecast for Cristobal. The first image below is the Sea Surface temperature for the POM ocean model coupled to the HWRF atmospheric model. We see the Loop Current is present, but it looks to be shifted west of the Loop Current seen in the data assimilative GOFS or in the CoastWatch altimetry product. It definitely is not up against the West Florida Shelf as it exits the Gulf. Along the 90W line we have been talking about, the water is relatively warm on much of the Yucatan Shelf, with some upwelling occurring on the shelf. But as you head north along 90W and leave the Yucatan Shelf, you encounter some of the coldest water in the Gulf. The large warm eddy observed in GOFS and the CoastWatch altimetric product centered near 25N, 90W is absent from POM.

So lets layer on the surface currents to search for the structures in the current field. The GOFS experience taught us that the SST may be confusing due to surface processes, and that the sea surface height and the surface currents are better for identifying the eddies. Below is a plot of the POM ocean model SST and Surface currents. The Loop Current is certainly present, but the anticyclonic circulation we have been talking about since last night is absent.
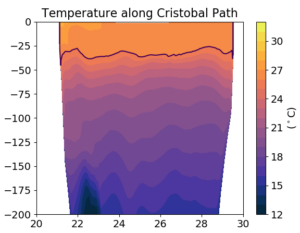
Ok, so lets just move straight to the subsurface section running from south to north along 90W. There is no bowl shaped warm core ring in the temperature section running from the Yucatan Shelf to the Louisiana Shelf. The 26C isotherm is pretty shallow, hovering around 30 m deep. Also wondering where the continental shelves on the north and south are. Looks like more to investigate.
-
An Argo Float from the critical Warm Eddy
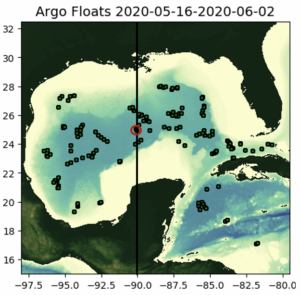
Posted on June 5th, 2020 No commentsHere we look back on the Argo floats locations for the last 20 days. Looking for one closer to the eddy center. So we chose one near 25N, 90W.
For the temperature comparison, we see the near surface region is similar in magnitude but with multiple mixed layers in temperature in the Argo data. Profiles at the depths below 600 m are also similar, but the main warm core of the eddy between 100 m and 600 m is different. Argo data is warmer than the model. Perhaps this is a true temperature difference, or perhaps it is simply a difference in location. That the real world Argo profile may be closer to the center of the eddy than the same location in the model. To help answer this question, it is often good to look at the profiles relative to an eddy center based coordinate system. We can do that in the model. More difficult in the data when you only have a single float profile and you can’t direct the float into the eddy center.
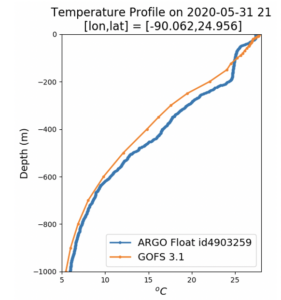
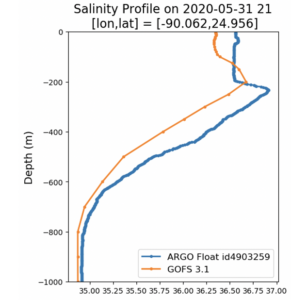
The same discussion applies to salinity. The core of the anticyclonic eddy is warm and salty. The Argo float is saltier than the model. Maybe the Argo float is closer to the eddy center? The Argo salinity profile also has a deeper mixed layer than the model. Is this a difference in surface mixing? or maybe it is part of the banding we see in the circulation around the eddy. Easier to check in the model. More difficult when you are dealing with a single profile instead of a cross-section through an eddy.
-
A quick check of the Satellite Altimetry
Posted on June 5th, 2020 No commentsHere is my new favorite place to look for satellite altimeter products in the Gulf of Mexico, the NOAA AOML site:
https://www.aoml.noaa.gov/phod/dhos/altimetry.php
I have been a long term user of the CCAR altimeter products for the Gulf, but I am not seeing it. Maybe our GCOOS friends have a recommendation for their go-to site for satellite altimetry. Was very happy to find this CoastWatch site from our friends at AOML. It has exactly the confirmation information we are seeking on the pre-storm ocean conditions.
In a previous blog post, we plotted the Sea Surface Height (SSH), and the surface currents, from the GOFS 3.1 model, noting that the Essential Ocean Features impacting hurricane intensity are well defined by SSH. Below is the CoastWatch altimeter product that plots the SSH (orange is high elevation, blue is low elevation) and the resulting geostrophic currents. The Loop Current flowing into and out of the Gulf is on the lower right. Nearly centered at 25N, 90W, is the large, warm core, Loop Current Eddy that Cristobal is forecast to track across tomorrow. Farther north and to the right of the forecast hurricane track is the Warm Eddy located just off the Florida panhandle continental shelf. In between the two warm, Anticyclonic eddies with the high elevations is the smaller area of low elevation associated with the cyclonic cold feature just south of the birdfoot. We clearly see the impact of the satellite altimeter in the data assimilative GOFS model.
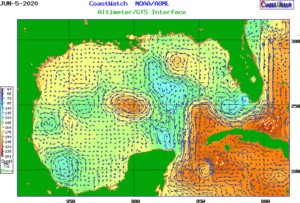
It looks like we are being given a well designed laboratory experiment with a tropical storm tracking directly over the center of a warm Anticyclonic ring. Except that this one is real.
A next step will be to look for any of the operational regional HWRF runs that use the feature model initialization approach, and compare to the operational data-assimilative global GOFS model.
-
Argo Floats in the Gulf
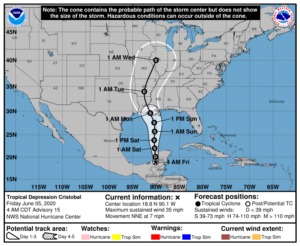
Posted on June 5th, 2020 No commentsNational Hurricane Center forecasters still have Cristobal following the 90W latitude line north across the Gulf starting this weekend
Here is a look at the Argo Floats in the Gulf that recently reported profiles between June 1-4. There are a couple near the north to south line along 90W.

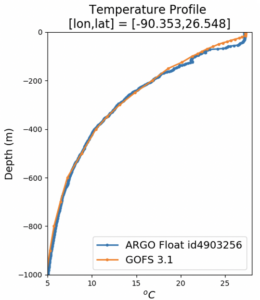
Below is a quick look at the first temperature profile compared to the Navy GOFS version 3.1. Everything below 200 m looks to be spot on. Above 200 m the observed Argo profile is a bit warmer, with a deeper mixed layer.
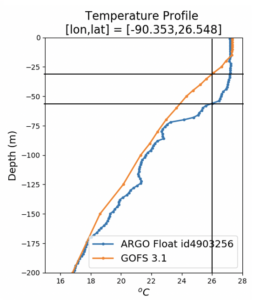
Zooming into the upper 200m, we can see the details of the warmer ARGO profile. Both have the same mixed layer temperature, but the mixed layer depth is less than 20 m and the argo float has it closer to 40 m. Using the depth of the 26C isotherm as another metric, we see it is about 30 m depth in GOFS and about 55 m deep in the Argo data.
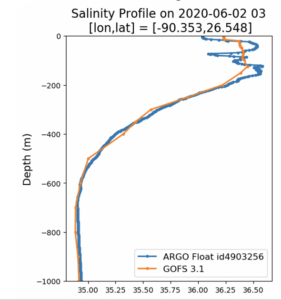
Now for the salinity comparison. As with temperature, the salinity comparison between GOFS and the Argo Float look very similar. In the upper 200 m, the salinity is much more variable. So lets zoom into the surface layer.
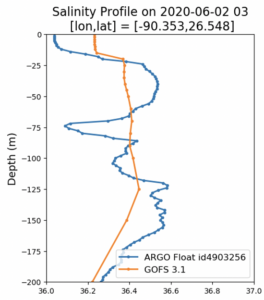
Below we zoom into the upper 200 m. Here the big question is the barrier layer. Temperature is nearly uniform down to a depth of about 50 m in the same profile, but the salinity profile indicates that there is a thin surface layer of low salinity water that is uncorrelated with the temperature. This is the critical barrier layer that inhibits mixing due to the resulting stratification. If we only had temperature observations, we might assume that the surface mixed layer is unstratified, and free to mix with the cold water below. The good news is that we do see the lower surface salinity in the GOFS model, but in the model, the low salinity surface layer is about 20 m deep and the temperature mixed layer is about 20 m deep. So the characteristics of the barrier layer are different. Salinity and temperature are well correlated in the upper layer of model, and are independent in the upper layer of the data.
More comparisons to come as we work through the day.
