-
Second Possible Target
Posted on November 9th, 2009 No comments

http://www.vesseltracker.com/en/Ships/Barcarolle-9116383.html
-
First possible target
Posted on November 9th, 2009 No commentsThe Thomas Jefferson
http://www.vesseltracker.com/en/Ships/Thomasjefferson-8892033.html


The signal is more in loop 2 and monopole which makes sense that the ship is to the left of the radar when looking to sea.
-
DHS Experiment Day 01
Posted on November 9th, 2009 No commentsWe’re conducting the first exercise today of the NY Observatory for the CSR grant. The SILD, SEAB, HOSR, HOOK HF Radar sites are operational. The BRZY site is not working. It was sent back to Codar for repairs. The SILD Tx and Rx were also sent back to Codar for repairs. We are using the multi frequency system at SILD in its place.
The current map for the harbor looks decent without BRZY.

SILD 25.1 MHz -100.7 kHz 2 Hz SWR Blank 486.6 us (43 km)
HOSR 24.65 MHz -100.7 KHz 2Hz SWR Blank 486.6 us (43 km)
SEAB 13.46 MHz -49 KHz 2Hz SWR Blank 668.8 us (60 km) enhanced blanking is turned on.
The range on the SEAB site is low.
-
Target All match
Posted on September 4th, 2009 No commentsThe following figures are taken from the file created by plot_all_matches. The file (trg_match_all.dat) is an output with the specified FFT length and Threshold. It is a very useful output because gives important information about the detection of the ship. In addition, this output is important because we can gather information that allows us to produce a graph on the map, showing the detection rate.


-
Potential Test Case
Posted on August 24th, 2009 No comments
Here is a potential test case to run the detection algorithm on. I looked on the AIS stream and saw that there were 3 vessels in the area. The Andre Jacob could be one of the vessels.


-
LOVE and BRIG
Posted on August 10th, 2009 No commentsWE follow the track of the MAAS TRADER down the south shore of New Jersey. And use the range files from LOVE and BRIG site to see if it was possible to detect it with the 5 mHz.
The results using the IIR method and Median Method are as follow For LOVE


These are the results for the BRIG site


Both sites detect ships but not the MAAS trader. It seems that the 5 mHz does detect ship but not the ship that we are looking for. I am doing more test and see if we can identify which ship the data is detecting.
-
Oleander and MAAS Trader
Posted on August 10th, 2009 No comments
This is the path of the MAAS trader and the Oleander for February 26 2009. The ships have different time track. The MAAS trader is traveling from 00:00 to 01:00 South heading to Brigantine. We lost the track between 01:00 – 03:00 and pick it up from 04:00 to 06:30.
The track of the Oleander is from 22:00 to 24:00. In this case the ship is moving away from the Radar, heading south-east, from Seabright.
In the next Figure is a comparison between the detection rate in SeaBright for the MAAS Trader and Oleander

The following is for the Oleander in SeaBright.

Take into consideration that is different time we do see different ships during that period of time. I need to identify which ships are and their characteristics.
-
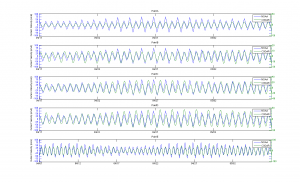
Tidal Analysis 3
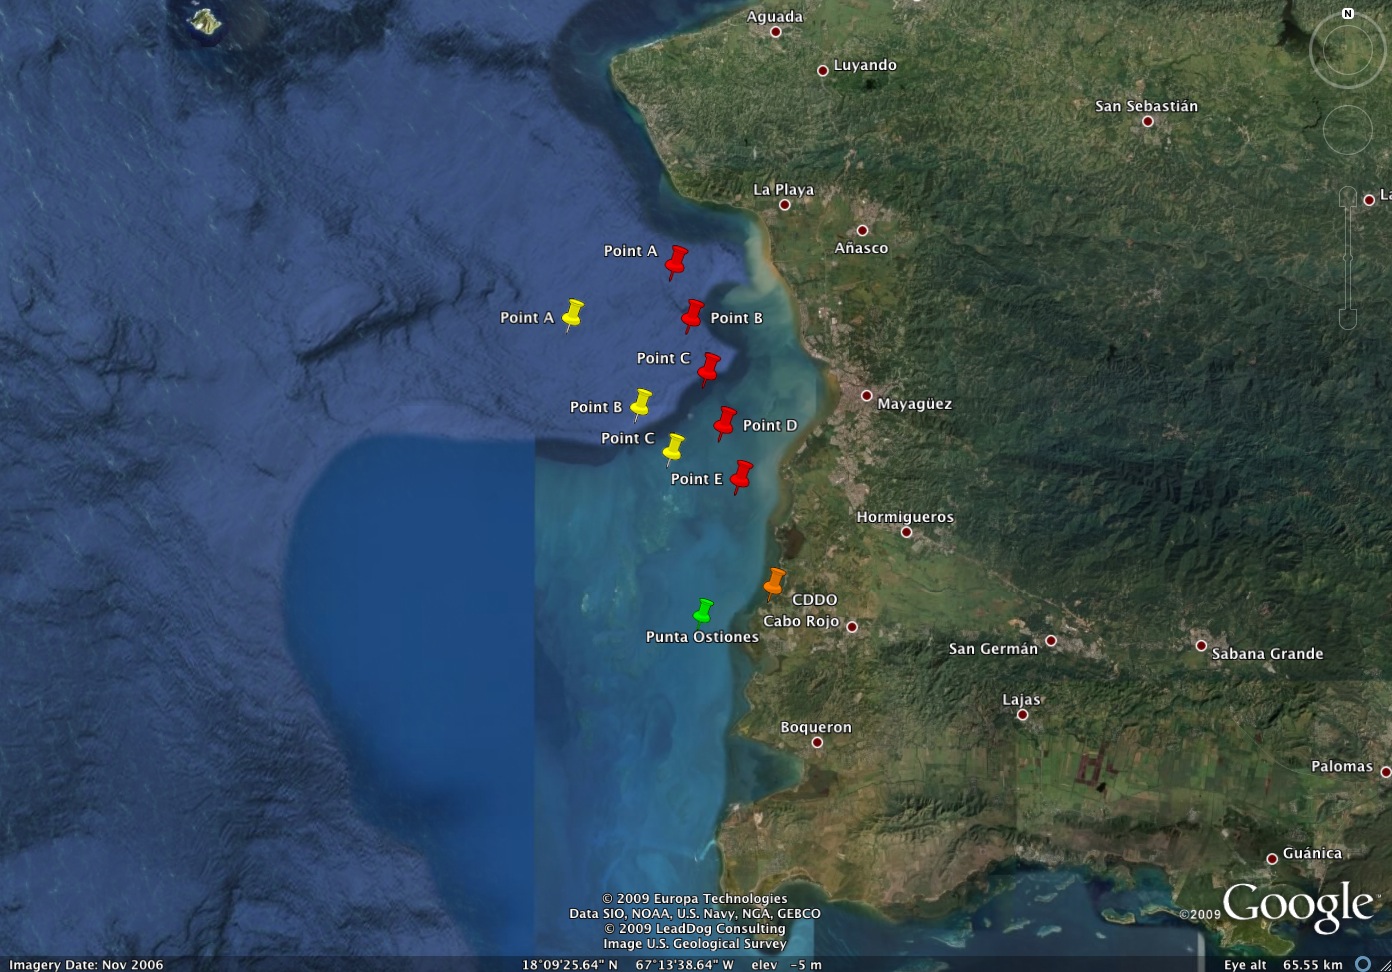
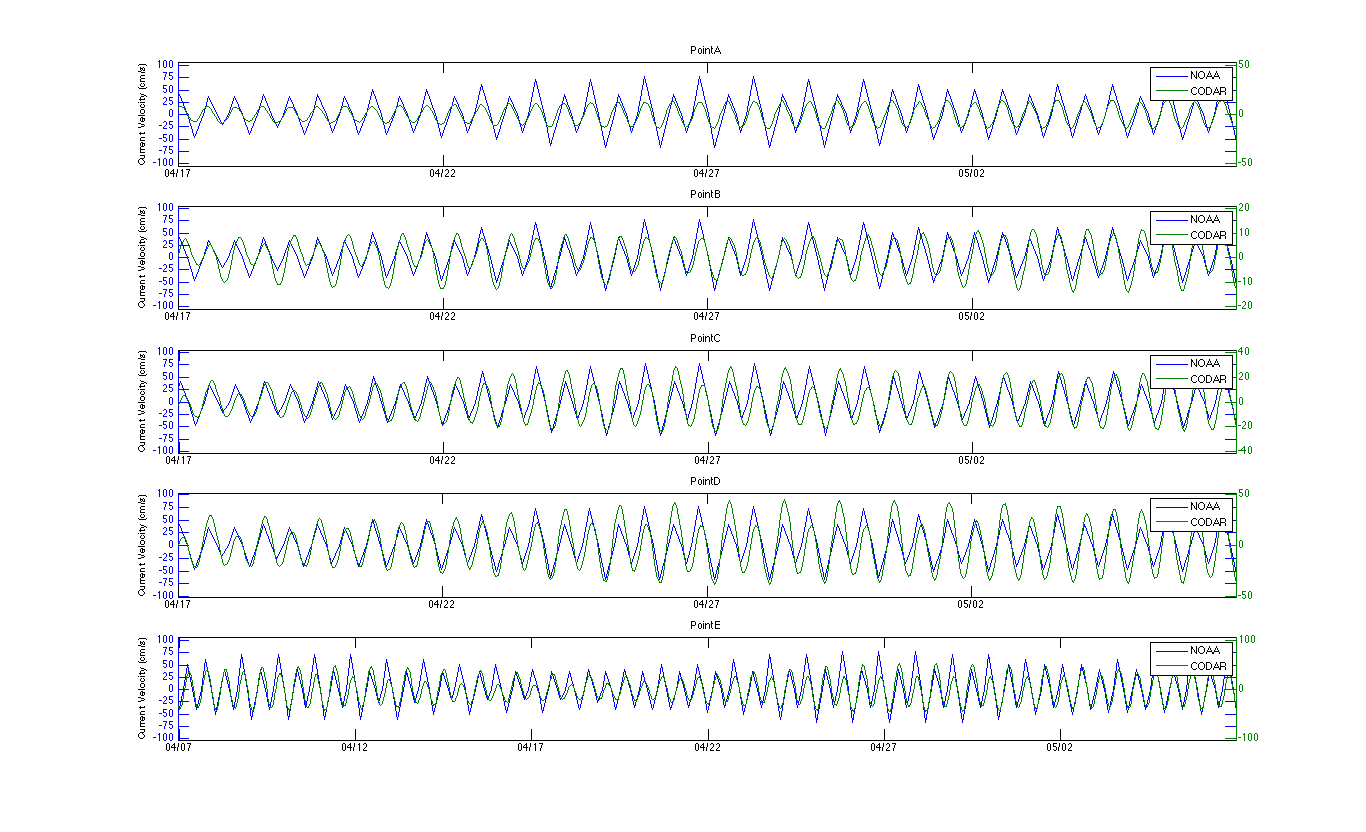
Posted on July 21st, 2009 No commentsTidal Analysis 3 compares NOAA current velocity predictions at Punta Ostiones with CODAR V component current velocity readings at 5 points oriented 343º from the station. Figure 1 shows five red placemarks labeled Point A through E, each one 3km or a range cell apart. Point A is located on range cell 6 while Point E is located on range cell 2. Yellow placemarks indicate the three points selected for Tidal Analysis 2.
Root mean square (RMS) speed differences between CODAR observations and NOAA predictions range from 28.7–8.4 cm/s. They improve significantly as we evaluate points closer to the CDDO station (e.g. At Point C an RMS speed difference of 21.1cm/s is found, at Point D the difference is 13.2 cm/s, and at Point E 8.4 cm/s). It is possible that bathymetry might be contributing substantially to this contrast. Correlation coefficients are highest at point A with a value of 0.8890. Other correlation coefficients range between 0.5385 and 0.6138.
Figure 2 compares the graphical output of NOAA current velocity predictions at Punta Ostiones with CODAR observed current velocity at selected points.
Figure 1
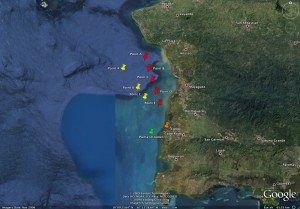
Figure 2
-
Outlines for posters
Posted on July 21st, 2009 No comments
Sam’s Outline

Andre’s Outline
-
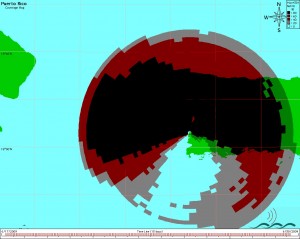
Inland Data in the CDDO site
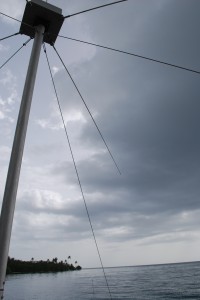
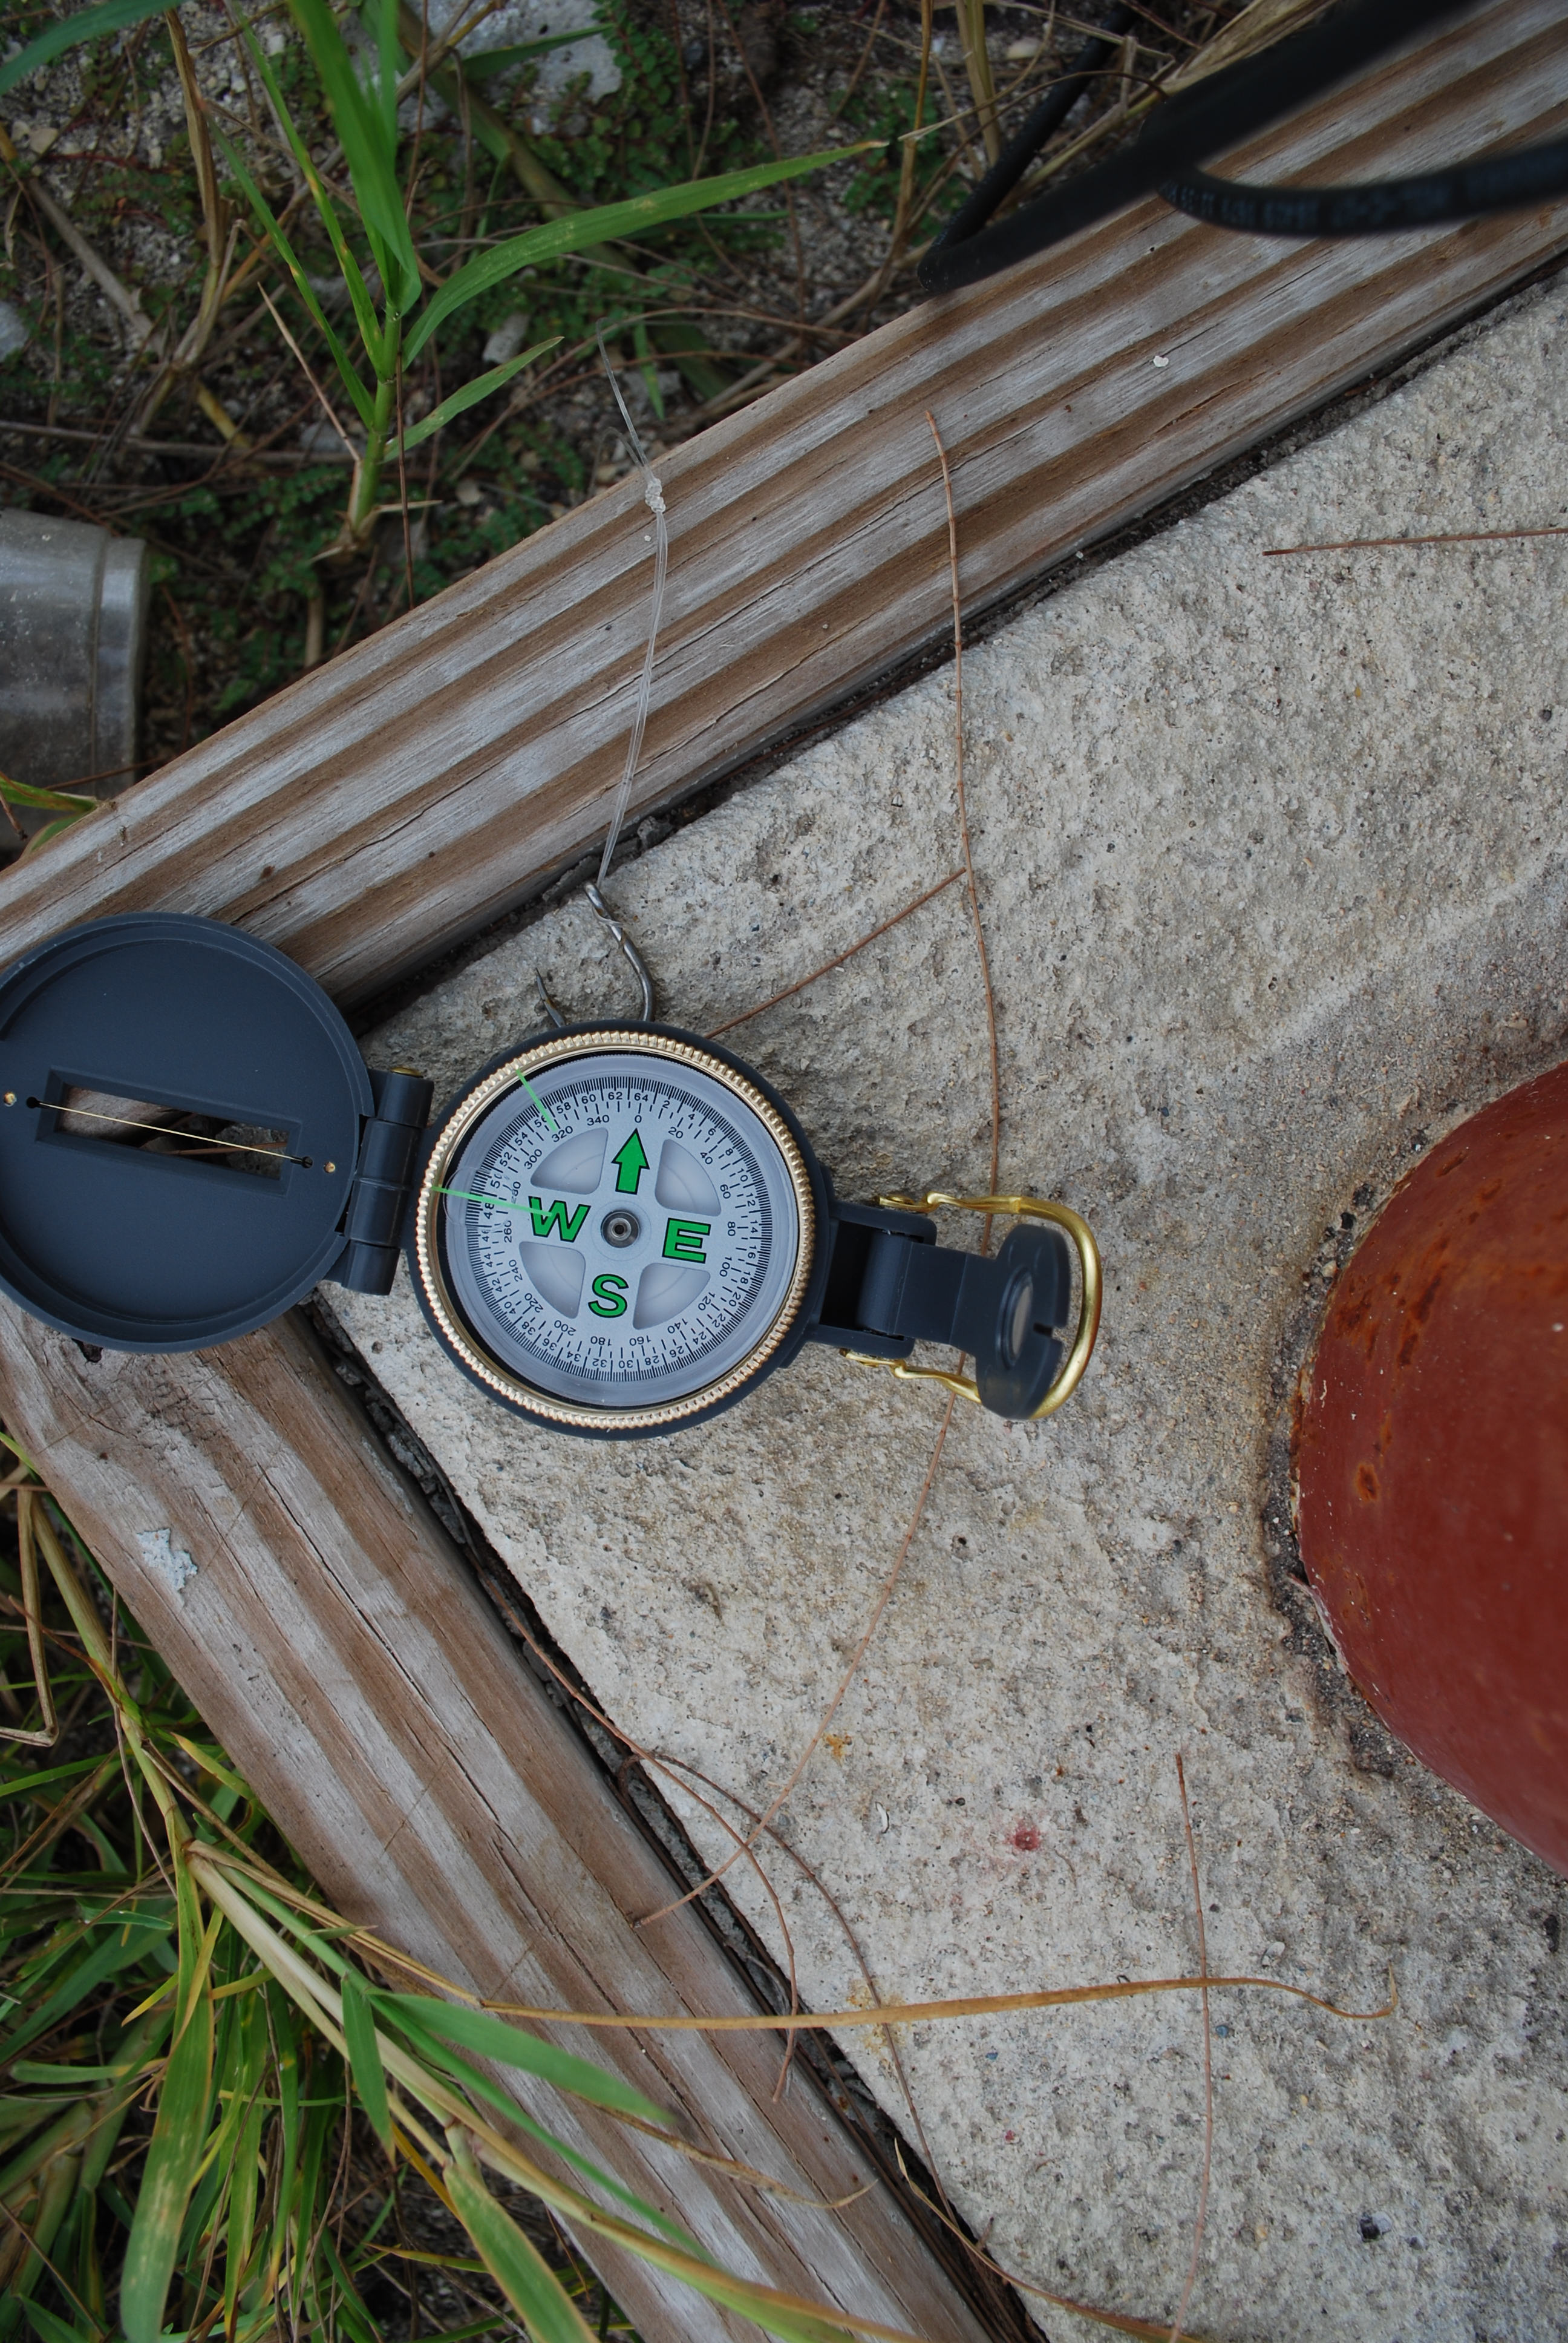
Posted on July 17th, 2009 No commentsCDDO site in Puerto Rico has been experiencing serious difficulties. As it can be seen on the picture below, the HF radar is gathering a great deal of inland data. This kind of data inhibits the effective mapping of currents, since SeaSonde software displays it as real affecting the product’s credibility and quality. This kind of problem prevents the system from being used as a rescue and emergency response tool. To try to solve this problem Damian Ruiz was contacted and asked to verify the bearing of the receiving antenna along with the connection of the cables. To our surprise everything seemed to be normal. In the photos it can be appreciated that the arrow for loop 1 is looking straight into the ocean as it’s suppose to be. Since everything appeared to be in order, our last resource is the antenna pattern measurement. This process requires experience as well as special instrumentation.
One hypothesis is that the signal is being amplified towards land by different communications devices in the marina. The other theory is that the southwestern part of the radar isn’t gathering any data because there might be something interfering with the signal such as metal towers, electrical cables, light poles, etc.