


-
Pelagia & GOFS and Copernicus Mercator
Posted on September 11th, 2018 No commentsHere is a first look at what the European global ocean model is saying for Pelagia.
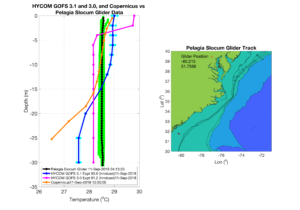
SST for Copernicus and GOFS 3.1 (the data assimilative initial condition for RTOFS) both have about the same surface temp.
That would be expected because they are both assimilating the similar global SST products.
Subsurface varies quite a bit between the models. All colder than the models.
GOFS 3.0 is closest to the glider, but likely for the wrong reason, the lower spatial resolution of GOFS 3.0 in shallow water tends to produce isothermal layers in shallow water that then adjust the surface temperature to match the satellite SST.
GOFS 3.1 and Copernicus clearly have the resolution to produce stratified continental shelves.
RTOFS is coming in closer to the glider. It takes a bit of time for the data flow to go through the system from the glider control center to the glider dac to ndbc to gts, so the PELAGIA profiles are probably just starting to appear in the NCEP tanks.
So these model profiles likely have very little data other than SST contributing to the assimilation.
This is what we hope to modify with the glider data and the GOFS 3.1 assimilation scheme.
As before – sending this out as fast as Maria is producing them so we can get this to Debra and Catherine for their briefs.
Thanks Maria. Thanks all.
Scott
-
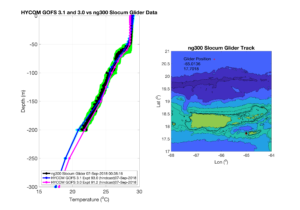
PELAGIA data-model comparison
Posted on September 11th, 2018 No commentsSending these along quickly to get them to partners at SECOORA and Skidaway University as fast as possible for the briefs they are giving.
They are of Glider PELAGIA deployed yesterday by Catherine Edwards for SECOORA.
Today’s plot is especially interesting, the mirror image of the issues in the Mid Atlantic.
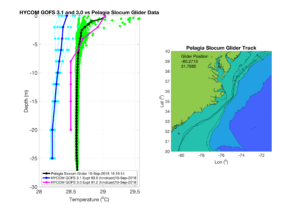
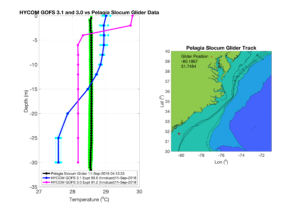
In this case the glider data is nearly isothermal, very warm, like 28.5 C.
But here the operational models have a two-layer structure with warmer surface temperatures and colder bottom temperatures.
There still is a lot to discover on how the operational ocean models respond compared to the real ocean observed by the glider.
And we need to remember that this is a global model, designed more for deepwater –
But it is a seamless ocean boundary condition for HWRF that runs from deepwater across the shelf – just like a hurricane.
We have the published evidence that the MAB shelf can impact the hurricane intensity, and now we will see in real time how the SAB shelf responds and possibly see if it has an impact on intensity.
We are making great progress and continuing to learn how to improve our forecast models.
Good luck to our friends in the South Atlantic Bight.
Scott
-
Some USVI Glider Data ahead of Isaac
Posted on September 10th, 2018 No commentsAnother couple of images.
First is the location plot for the 3 USVI gliders from the GOC via Doug Wilson.
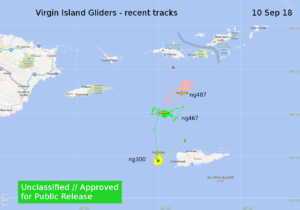
Second is the comparison of NG300 with GOFS 3.1 and 3.0 via Maria Aristizabal.
Also Ben Lacour and John Kerfoot have been looking at the data flow and are seeing the Navy gliders show up in the NCEP data tanks.
More to come tomorrow.
Scott
-
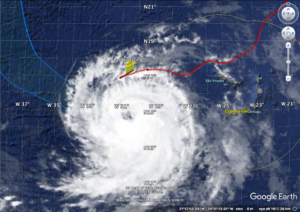
Hurricane Helene and Silbo in the eastern Atlantic
Posted on September 10th, 2018 No comments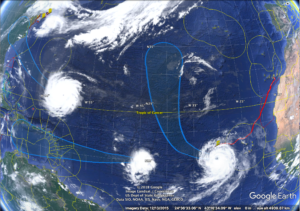
Just wanted to share these images of Helene and Silbo while we were working on the model-data comparisons for ramses and a Navy glider in the Caribbean.
-
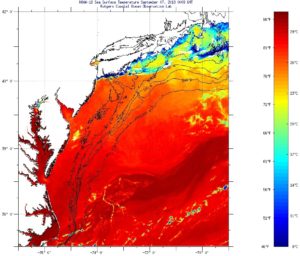
September 10 SST Imagery
Posted on September 10th, 2018 No commentsWhat a wonderful picture of the bottom layer in GOFS 3.1.
That bottom layer was always an unmet challenge in 3.0.
Perhaps both models are being pulled to a warmer SST by the assimilation of the satellite data.
Last good image of the area I have is Sept 7, a couple days before this plot.
SSTs maybe near 25C, but a little hard to read the color scale.
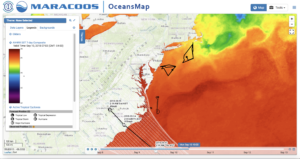
MARACOOS OceansMap 7-day composite SST also looks to be near that 24C mark.
All good things to investigate with the data assimilators at Stennis.
Scott
-
September 10th Glider RU33 GOFS 3.1 and GOFS 3.0 Comparisons
Posted on September 10th, 2018 No commentsComparisons for RU33 in the MAB show that both GOFS 3.1 and GOFS 3.0 are over predicting sea surface temperature.
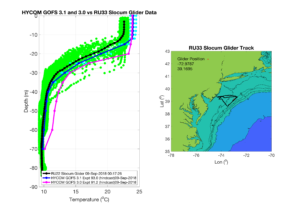
We’ll shortly be adding comparisons to additional gliders deployed throughout the eastern US and Caribbean.
Travis
-
Three Storms in the Atlantic
Posted on September 10th, 2018 No commentsA couple of images for your morning briefs from MARACOOS OceansMap.
Three hurricanes in the Atlantic – Florence, Isaac and Helene.
We have gliders deployed and reporting to the IOOS Glider DAC on the right side of each hurricane.
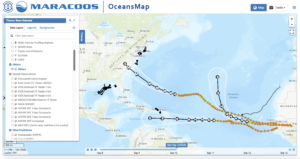
The first image shows hurricanes and gliders only.
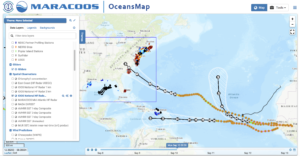
Second turns on the IOOS HFRnet, which unfortunately hides the MAB gliders from view.
So you have to choose one or the other based on your need to highlight gliders or HFR.
Good luck to Catherine on the deployment.
Scott
-
Glider RU33 Comparison to GOFS 3.0 & 3.1
Posted on September 9th, 2018 No commentsHere are the first model-data comparisons for the hurricane gliders and the operational models produced by our IOOS hurricane post-doc Maria Aristizabal. Maria just started this past week and is harvesting glider data from the IOOS Glider DAC to compare to the operational models.
Our plan was to start with the Navy gliders in the Caribbean, but Florence changed those plans. We’ll turn to Isaac and the Caribbean as we spin up this up with Florence. We are harvesting the glider data from the DAC because we can get IOOS gliders, Navy gliders, OOI gliders and others all in this one place in one format. And we will be adding more operational models, focused on Copernicus Mercator next to compare to the European global model.
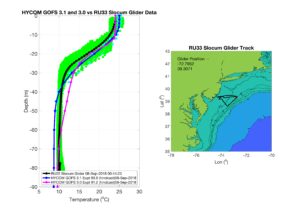
Our first comparisons focus on the vertical structure, comparing a day’s worth of glider data (green) and the daily average glider profile (black) with the operational HYCOM initialized with GOFS 3.0 and GOFS 3.1.
We chose glider RU33 for the first comparisons since it is the IOOS glider closest to Florence. The three plots are for Aug 6, 7 & 8 as RU33 approaches the shelf break.
On the shelf the differences between GOFS 3.0 & 3.1 are bigger, with GOFS 3.1 doing a better job getting the upper ocean structure, and the glider splitting the difference between the cooler 3.1 and the warmer 3.0.
The issue we want to start investigating right away with our Navy partners at NRL is how is this glider data being treated by the GOFS data assimilation system. We know GOFS 3.0 rejected much of our glider data in previous years since it was so different from the model. We still need to learn what GOFS 3.1 thinks of the glider data.
With Florence forecast centered on southern North Carolina, the email discussions with Catherine Edwards spun up quickly with yesterday. Catherine has a glider for PEACH up by Cape Hatteras and is planning to deploy a glider for SECOORA of Skidaway University in Georgia Tuesday. Catherine has been talking with Travis Miles and Maria to help get the Skidaway data into the IOOS Glider DAC if it is needed, and Maria is watching for any data that does come through so we can push this comparison through.
For glider Blue, the UMass glider deployed for IOOS in the northern MAB, the IOOS Glider DAC software team worked through some of the software issues and reloaded Blue this weekend. Everyone is chipping in.
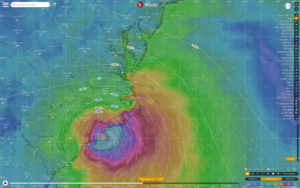
Lastly is an image of the forecast winds from Florence forecast for landfall that Donglai Gong passed on to me yesterday. It shows that even with the landfall in NC we still have strong winds in the southern MAB because of the size of the storm. Also from Donglai, the winds are forecast to blow into the Chesapeake Bay and there is forecast over a foot of rain over Virginia. So likely a high water event and a large freshwater discharge event effecting the fall surface stratification in the MAB.
This may be something like we saw in 2011 in the HFR data with the big discharge event from Irene and Lee.
Would be great if we could get a glider out in the Southern MAB. As some may be aware, our glider picket line plan for the MAB targets 5 gliders doing the cross shelf triangles for the hurricane season. The minimum would be 3 gliders, one each in the north, central and southern MAB. We made a big step this year and were able to deploy 2 IOOS hurricane picket line gliders in the MAB, Blue from UMass in the northern MAB, and RU33 in the central MAB. But we don’t have the 3rd in the southern MAB.
Thanks all.
Have a good weekend.
Scott
-
Quality Control of Bistatic Signals
Posted on June 7th, 2012 No commentsRobert Forney and I configured the RATH site to receive bistatic signals from WOOD. We turned this on Tuesday June 5th. We ran it for 19 hours and looked at the data. There were several large vectors in each of the elliptical maps. We looked at the elliptical options.txt file and saw that line 6 DC RC start was set to 45 when it should have been set to 50. We changed it to 50 and reprocessed the data. We placed the original data set on the desktop in a folder called “Elliptical Data”. The data spans from June 5 1800 to June 6 1300.
-
Radial Coverage for March 2012
Posted on April 23rd, 2012 No comments


