


-
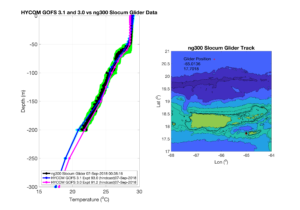
Gliders NG330 & SG630 in the Caribbean
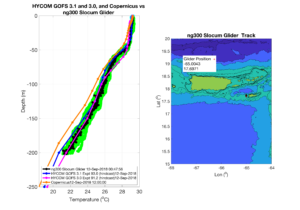
Posted on September 13th, 2018 No commentsNow standard glider data/operational model comparison plots for the Caribbean hours ahead of Isaac. First is Navy Glider NG300 station keeping west of St. Croix.
Second is the NOAA AOML Seaglider SG630 running the north-south transect on the southern side of Puerto Rico.

As we discovered over the last few days, all the operational models are doing fairly well in this region. GOFS 3.1 has been a consistent good performer.
The issue we now want to investigate in the Caribbean is salinity. Our focus for this first week of work has been temperature, to see how we are doing with heat content before the storms arrive. Salinity has an important impact during the storm, specifically, the fresh water layers we expect to see near the surface that inhibit mixing.
-
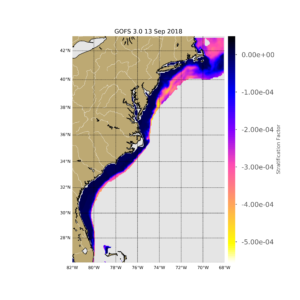
Stratification Factor Maps
Posted on September 13th, 2018 No commentsBelow is today’s Stratification Factor map for GOFS 3.1. Very little stratification in the South Atlantic Bight, much larger stratification in the Middle Atlantic Bight especially from midshelf and beyond. Light colors are strong stratification, dark colors are weak stratification.
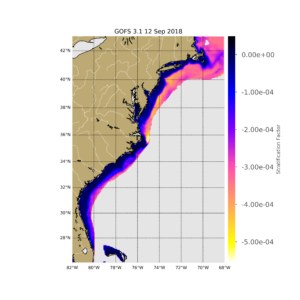
Stratification in GOFS 3.0 is significantly reduced in both the SAB and MAB.
-
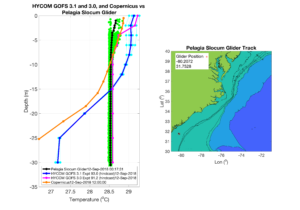
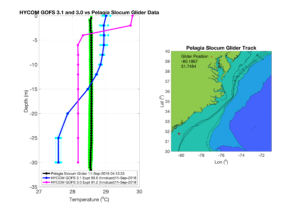
Gliders Pelagia and Ramses
Posted on September 13th, 2018 No commentsHere are glider data-model comparisons for the two gliders being flown by Catherine Edwards at Skidaway.
Pelagia is located near the SC/GA border and is nearly isothermal but with the daily variation in temperature near the surface averaging to a small increase in the daily average temperature. GOFS 3.1 has the least vertical variability.
Ramses deployed north of Cape Hatteras indicates there is strong two-layer system with significant stratification, and GOFS 3.1 is doing the best job of capturing it.
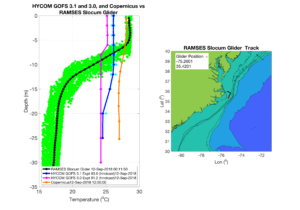
From Maria:
“It is interesting to see that for Ramses the water column is very stratified, with a surface to bottom temperature difference of about 12 degrees celsius, but some of the models show weak stratification (about 1 degree surface to bottom temperature differences). For Pelagia the situation is completely opposite: the temperature is almost vertically uniform but the models present some stratification.”
-
SAB & MAB Stratification in GOFS 3.1
Posted on September 12th, 2018 No commentsWe use the Non-dimensional Potential Energy Anomaly, what we call the Stratification Factor, to represent the stratification structure on the continental shelf with one number so we can plot it as a map.
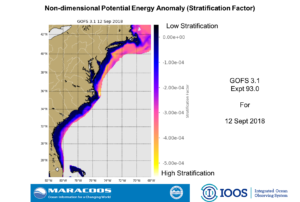
This first plot says that according to GOFS 3.1, the MAB shelf is highly stratified and the SAB shelf is much less stratified.
You can even see the very high stratification in the PEACH area just north of Cape Hatteras.
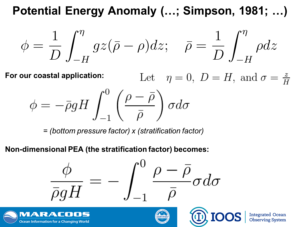
The first slide is the derivation of the Stratification Factor, and the second slide shows the current conditions in 3.1
Thanks.
Scott
-
OOI Gliders in the Glider DAC
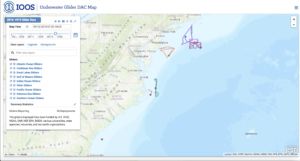
Posted on September 12th, 2018 No commentsHere are 3 maps people may find useful for their daily briefs.
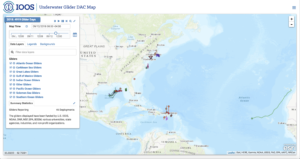
First image is the IOOS Glider DAC showing the entire North Atlantic fleet.
The change from yesterday is the NSF OOI gliders are back in. Yesterday afternoon Mike Crowley worked on resolving the metadata issues and John Kerfoot was able to get the OOI Pioneer Array gliders back into the DAC. So now this NSF OOI data is also going to the DAC and onto the GTS and into the models.
This image is an unprecendented combination of NOAA, Navy, NSF and Industry (TWR’s glider SILBO in Helene) supported gliders all collaborating through the IOOS Glider DAC to support our Weather-Ready Nation’s efforts to be better prepared for hurricanes.
Its inspiring, but with my own memories of Sandy, still difficult knowing what is in store for the southeast.
Second image zooms into the East Coast picket line, where you can now see the individual OOI gliders that were added to the mix last night.
The line up from south to north is
Catherine Edwards PELIGIA deployed for SECOORA.
Catherine Edwards deployed UNC RAMSES for NSF PEACH.
NOAA Spray
Travis Miles RU33
Wendell Brown UMass BLUE.
NSF OOI.
I know this is a glider distribution list, but there is a similar level of involvement in the IOOS HF Radar community.
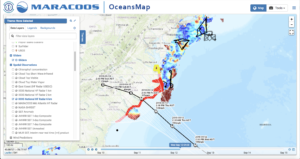
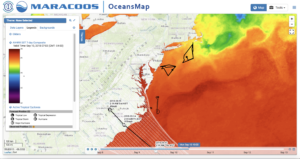
Third image is from the MARACOOS OceansMap were we have taken the IOOS Glider DAC gliders, added the NHC Florence forecast cone, and also turned on the IOOS National HF Radar network 6 km grid (as you see in the menu on the left).
In the MAB, it was the combination of the gliders, the HFR, the satellites, and the 30-year time series of NDBC buoy data that made possible the scientific analysis and essential ocean process discovery that led to the science papers that provided the scientific basis for the change in approach that we see active today.
Thanks to the long list of people that worked with increasing intensity for months so that this array can be in place.
We will be looking at more gliders in the model data comparisons today. If anyone needs something special, let me know, and we will jump it in the queue.
Thanks all. Stay safe.
Scott
-
Pelagia & GOFS and Copernicus Mercator
Posted on September 11th, 2018 No commentsHere is a first look at what the European global ocean model is saying for Pelagia.
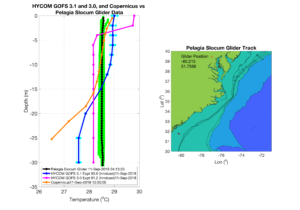
SST for Copernicus and GOFS 3.1 (the data assimilative initial condition for RTOFS) both have about the same surface temp.
That would be expected because they are both assimilating the similar global SST products.
Subsurface varies quite a bit between the models. All colder than the models.
GOFS 3.0 is closest to the glider, but likely for the wrong reason, the lower spatial resolution of GOFS 3.0 in shallow water tends to produce isothermal layers in shallow water that then adjust the surface temperature to match the satellite SST.
GOFS 3.1 and Copernicus clearly have the resolution to produce stratified continental shelves.
RTOFS is coming in closer to the glider. It takes a bit of time for the data flow to go through the system from the glider control center to the glider dac to ndbc to gts, so the PELAGIA profiles are probably just starting to appear in the NCEP tanks.
So these model profiles likely have very little data other than SST contributing to the assimilation.
This is what we hope to modify with the glider data and the GOFS 3.1 assimilation scheme.
As before – sending this out as fast as Maria is producing them so we can get this to Debra and Catherine for their briefs.
Thanks Maria. Thanks all.
Scott
-
PELAGIA data-model comparison
Posted on September 11th, 2018 No commentsSending these along quickly to get them to partners at SECOORA and Skidaway University as fast as possible for the briefs they are giving.
They are of Glider PELAGIA deployed yesterday by Catherine Edwards for SECOORA.
Today’s plot is especially interesting, the mirror image of the issues in the Mid Atlantic.
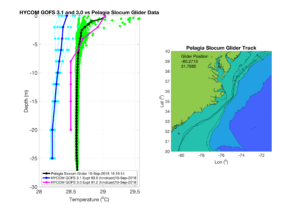
In this case the glider data is nearly isothermal, very warm, like 28.5 C.
But here the operational models have a two-layer structure with warmer surface temperatures and colder bottom temperatures.
There still is a lot to discover on how the operational ocean models respond compared to the real ocean observed by the glider.
And we need to remember that this is a global model, designed more for deepwater –
But it is a seamless ocean boundary condition for HWRF that runs from deepwater across the shelf – just like a hurricane.
We have the published evidence that the MAB shelf can impact the hurricane intensity, and now we will see in real time how the SAB shelf responds and possibly see if it has an impact on intensity.
We are making great progress and continuing to learn how to improve our forecast models.
Good luck to our friends in the South Atlantic Bight.
Scott
-
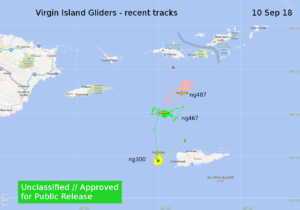
Some USVI Glider Data ahead of Isaac
Posted on September 10th, 2018 No commentsAnother couple of images.
First is the location plot for the 3 USVI gliders from the GOC via Doug Wilson.
Second is the comparison of NG300 with GOFS 3.1 and 3.0 via Maria Aristizabal.
Also Ben Lacour and John Kerfoot have been looking at the data flow and are seeing the Navy gliders show up in the NCEP data tanks.
More to come tomorrow.
Scott
-
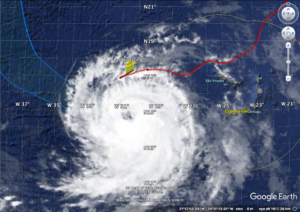
Hurricane Helene and Silbo in the eastern Atlantic
Posted on September 10th, 2018 No comments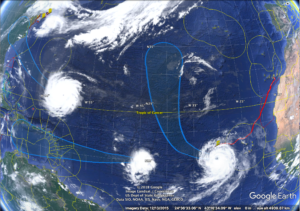
Just wanted to share these images of Helene and Silbo while we were working on the model-data comparisons for ramses and a Navy glider in the Caribbean.
-
September 10 SST Imagery
Posted on September 10th, 2018 No commentsWhat a wonderful picture of the bottom layer in GOFS 3.1.
That bottom layer was always an unmet challenge in 3.0.
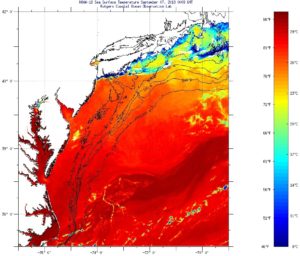
Perhaps both models are being pulled to a warmer SST by the assimilation of the satellite data.
Last good image of the area I have is Sept 7, a couple days before this plot.
SSTs maybe near 25C, but a little hard to read the color scale.
MARACOOS OceansMap 7-day composite SST also looks to be near that 24C mark.
All good things to investigate with the data assimilators at Stennis.
Scott
