


-
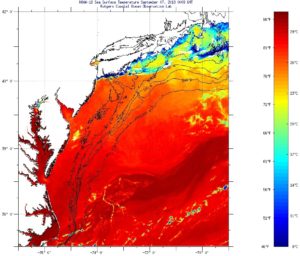
September 10 SST Imagery
Posted on September 10th, 2018 No commentsWhat a wonderful picture of the bottom layer in GOFS 3.1.
That bottom layer was always an unmet challenge in 3.0.
Perhaps both models are being pulled to a warmer SST by the assimilation of the satellite data.
Last good image of the area I have is Sept 7, a couple days before this plot.
SSTs maybe near 25C, but a little hard to read the color scale.
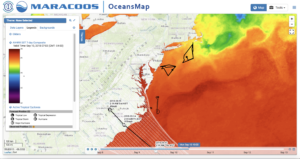
MARACOOS OceansMap 7-day composite SST also looks to be near that 24C mark.
All good things to investigate with the data assimilators at Stennis.
Scott
-
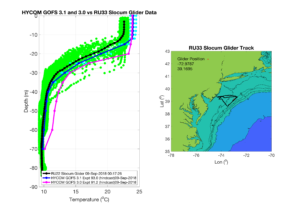
September 10th Glider RU33 GOFS 3.1 and GOFS 3.0 Comparisons
Posted on September 10th, 2018 No commentsComparisons for RU33 in the MAB show that both GOFS 3.1 and GOFS 3.0 are over predicting sea surface temperature.
We’ll shortly be adding comparisons to additional gliders deployed throughout the eastern US and Caribbean.
Travis
-
Three Storms in the Atlantic
Posted on September 10th, 2018 No commentsA couple of images for your morning briefs from MARACOOS OceansMap.
Three hurricanes in the Atlantic – Florence, Isaac and Helene.
We have gliders deployed and reporting to the IOOS Glider DAC on the right side of each hurricane.
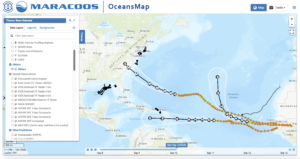
The first image shows hurricanes and gliders only.
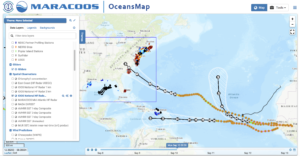
Second turns on the IOOS HFRnet, which unfortunately hides the MAB gliders from view.
So you have to choose one or the other based on your need to highlight gliders or HFR.
Good luck to Catherine on the deployment.
Scott
-
Glider RU33 Comparison to GOFS 3.0 & 3.1
Posted on September 9th, 2018 No commentsHere are the first model-data comparisons for the hurricane gliders and the operational models produced by our IOOS hurricane post-doc Maria Aristizabal. Maria just started this past week and is harvesting glider data from the IOOS Glider DAC to compare to the operational models.
Our plan was to start with the Navy gliders in the Caribbean, but Florence changed those plans. We’ll turn to Isaac and the Caribbean as we spin up this up with Florence. We are harvesting the glider data from the DAC because we can get IOOS gliders, Navy gliders, OOI gliders and others all in this one place in one format. And we will be adding more operational models, focused on Copernicus Mercator next to compare to the European global model.
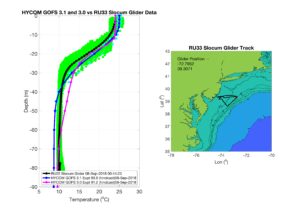
Our first comparisons focus on the vertical structure, comparing a day’s worth of glider data (green) and the daily average glider profile (black) with the operational HYCOM initialized with GOFS 3.0 and GOFS 3.1.
We chose glider RU33 for the first comparisons since it is the IOOS glider closest to Florence. The three plots are for Aug 6, 7 & 8 as RU33 approaches the shelf break.
On the shelf the differences between GOFS 3.0 & 3.1 are bigger, with GOFS 3.1 doing a better job getting the upper ocean structure, and the glider splitting the difference between the cooler 3.1 and the warmer 3.0.
The issue we want to start investigating right away with our Navy partners at NRL is how is this glider data being treated by the GOFS data assimilation system. We know GOFS 3.0 rejected much of our glider data in previous years since it was so different from the model. We still need to learn what GOFS 3.1 thinks of the glider data.
With Florence forecast centered on southern North Carolina, the email discussions with Catherine Edwards spun up quickly with yesterday. Catherine has a glider for PEACH up by Cape Hatteras and is planning to deploy a glider for SECOORA of Skidaway University in Georgia Tuesday. Catherine has been talking with Travis Miles and Maria to help get the Skidaway data into the IOOS Glider DAC if it is needed, and Maria is watching for any data that does come through so we can push this comparison through.
For glider Blue, the UMass glider deployed for IOOS in the northern MAB, the IOOS Glider DAC software team worked through some of the software issues and reloaded Blue this weekend. Everyone is chipping in.
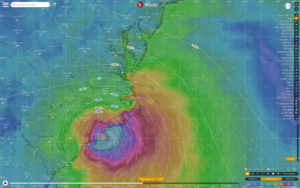
Lastly is an image of the forecast winds from Florence forecast for landfall that Donglai Gong passed on to me yesterday. It shows that even with the landfall in NC we still have strong winds in the southern MAB because of the size of the storm. Also from Donglai, the winds are forecast to blow into the Chesapeake Bay and there is forecast over a foot of rain over Virginia. So likely a high water event and a large freshwater discharge event effecting the fall surface stratification in the MAB.
This may be something like we saw in 2011 in the HFR data with the big discharge event from Irene and Lee.
Would be great if we could get a glider out in the Southern MAB. As some may be aware, our glider picket line plan for the MAB targets 5 gliders doing the cross shelf triangles for the hurricane season. The minimum would be 3 gliders, one each in the north, central and southern MAB. We made a big step this year and were able to deploy 2 IOOS hurricane picket line gliders in the MAB, Blue from UMass in the northern MAB, and RU33 in the central MAB. But we don’t have the 3rd in the southern MAB.
Thanks all.
Have a good weekend.
Scott
