-
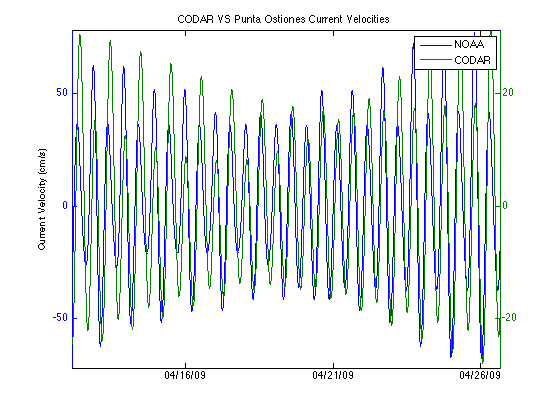
Correlation Between NOAA Predicted Currents and CODAR Observed Currents
Posted on July 17th, 2009 No commentsAn effective correlation can only be carried out in Matlab if both data sets have the same length (same amount of data points), therefore both time series – NOAA predicted currents at Punta Ostiones and CODAR observed currents – were subjected to the Fast Fourier Transform method and subsequently interpolated at 1-minute intervals. Then data was analyzed and plotted within the same period of time – April 1, 2009 to May 31, 2009. Correlation was performed using corrcoef function, which yielded a value of 0.69. It is worth noting that the algorithm is now set to calculate M2, S2, N2, K2, K1, O1, P1, Q1 tidal constituents as advised by Dr. Jorge Capella.
-
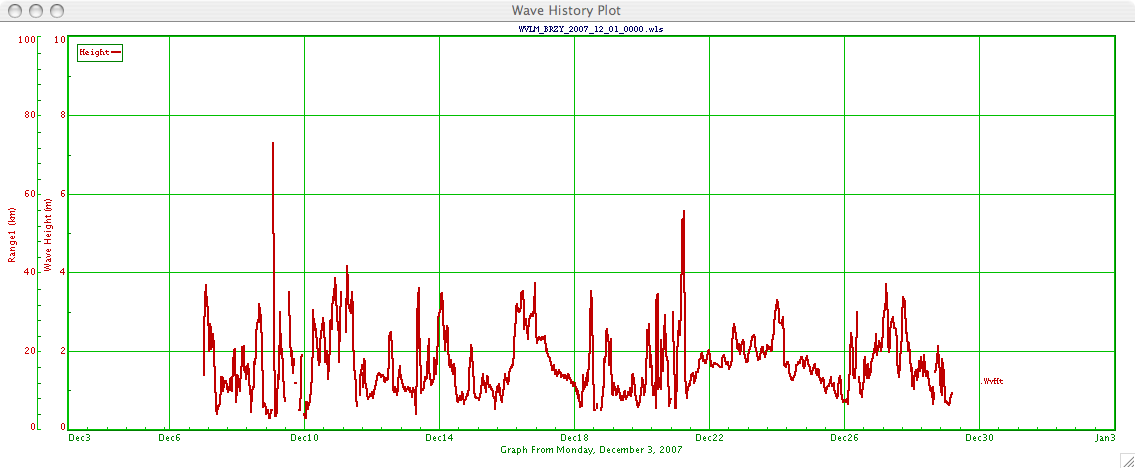
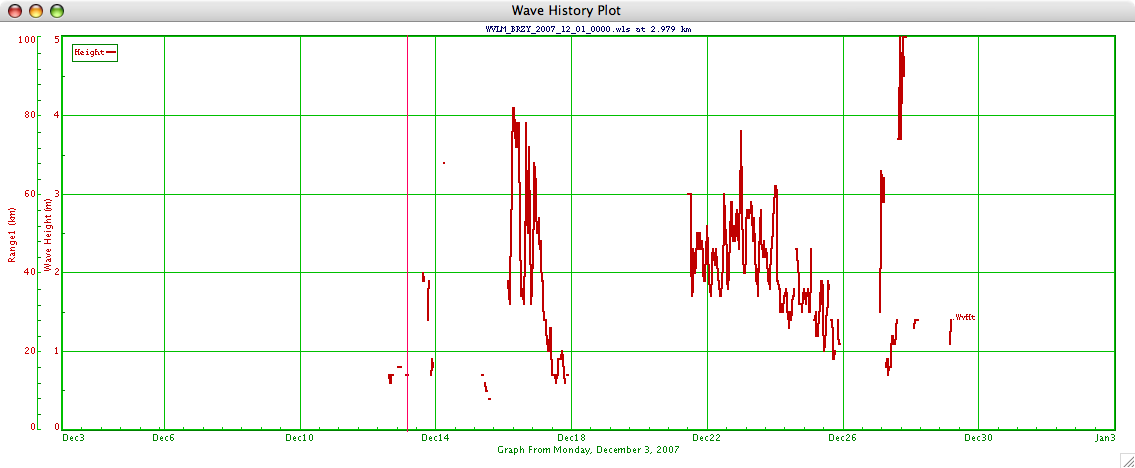
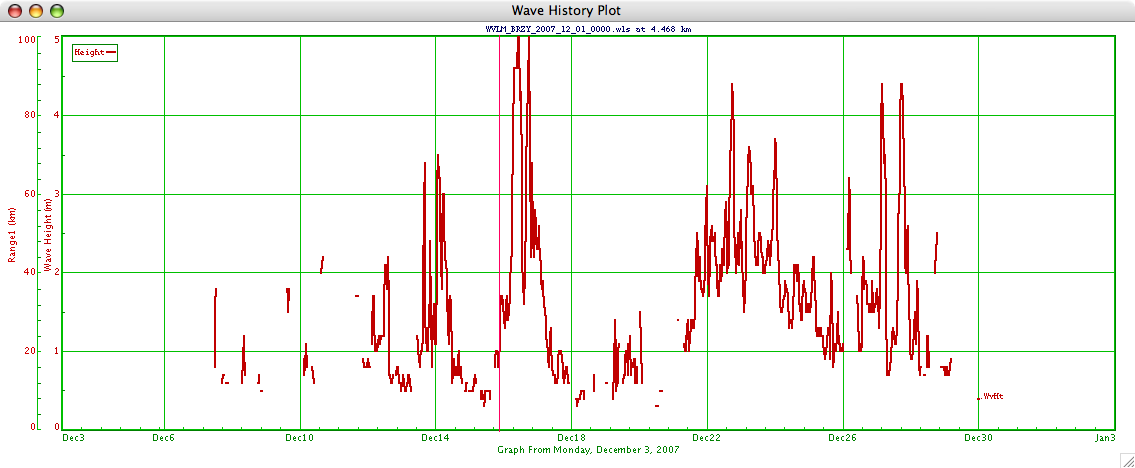
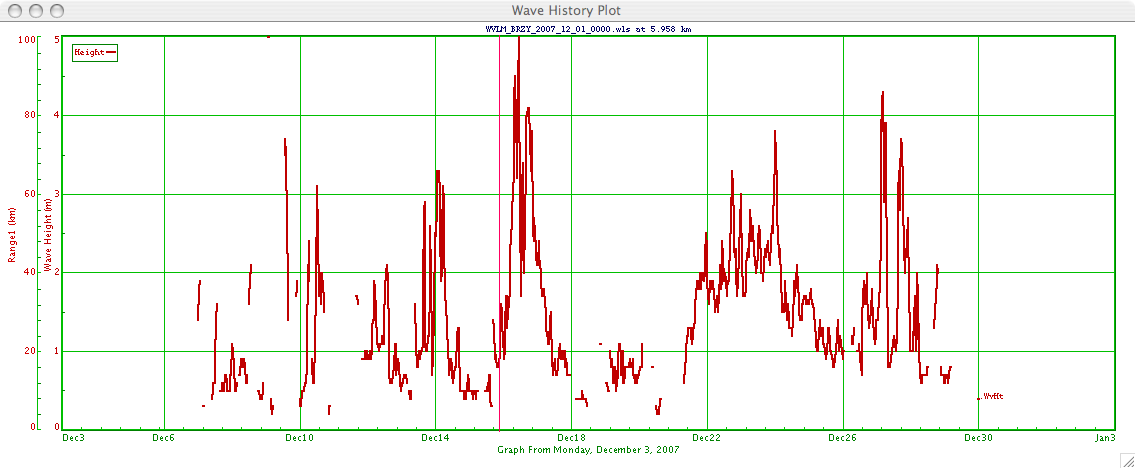
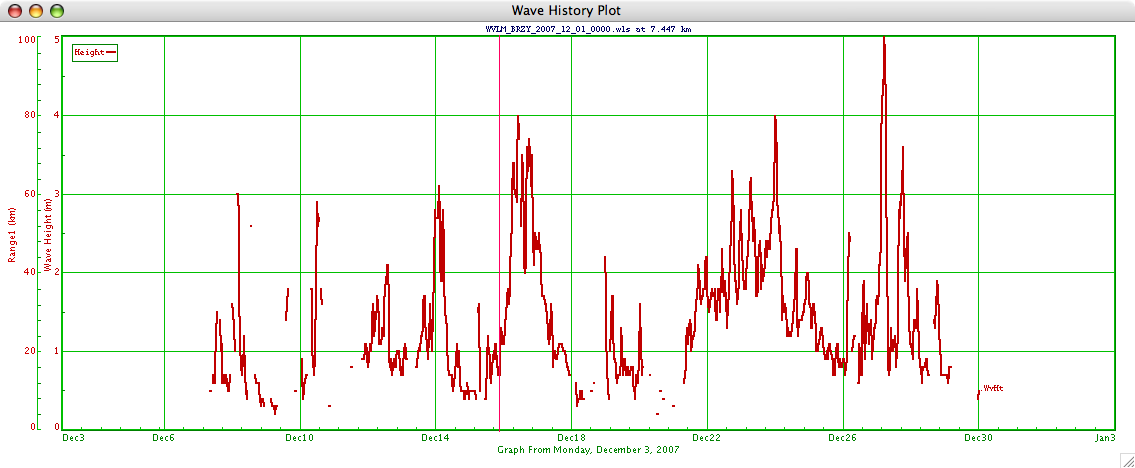
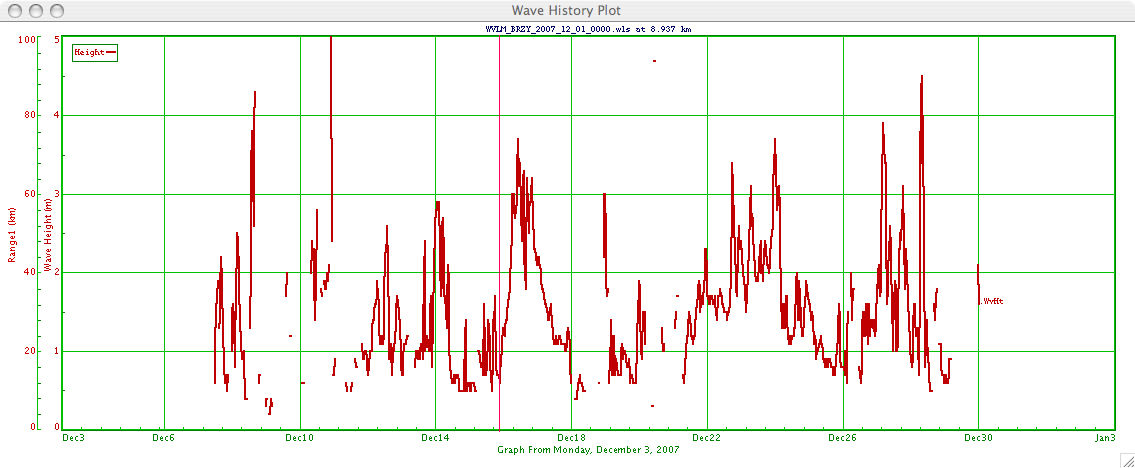
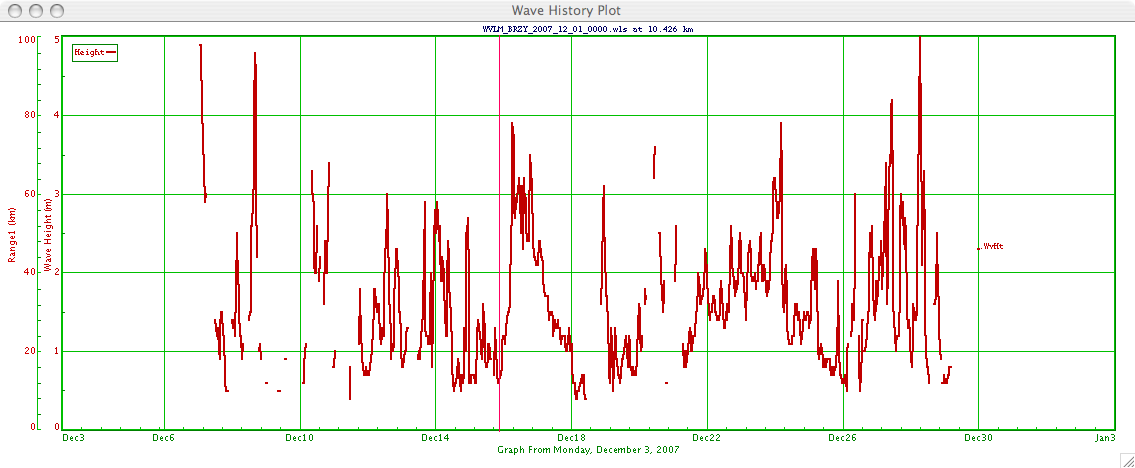
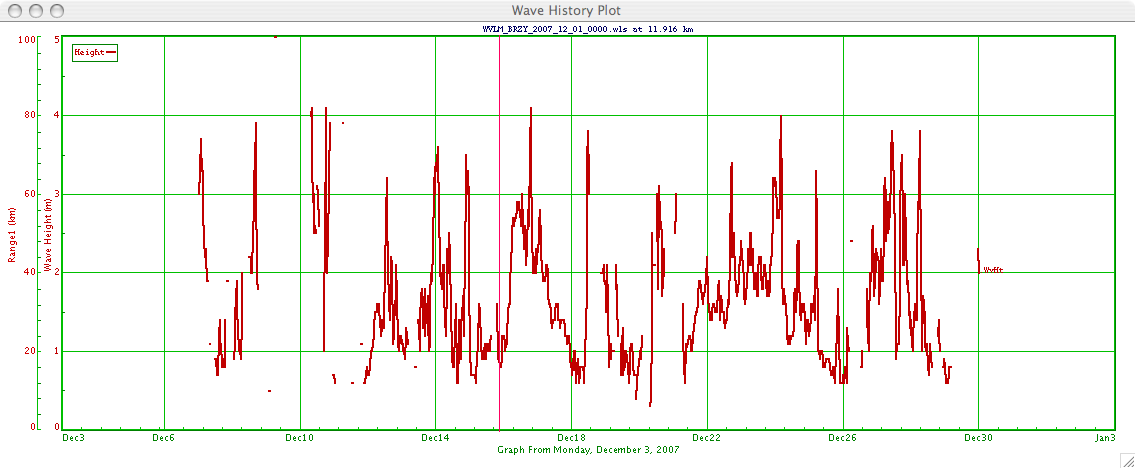
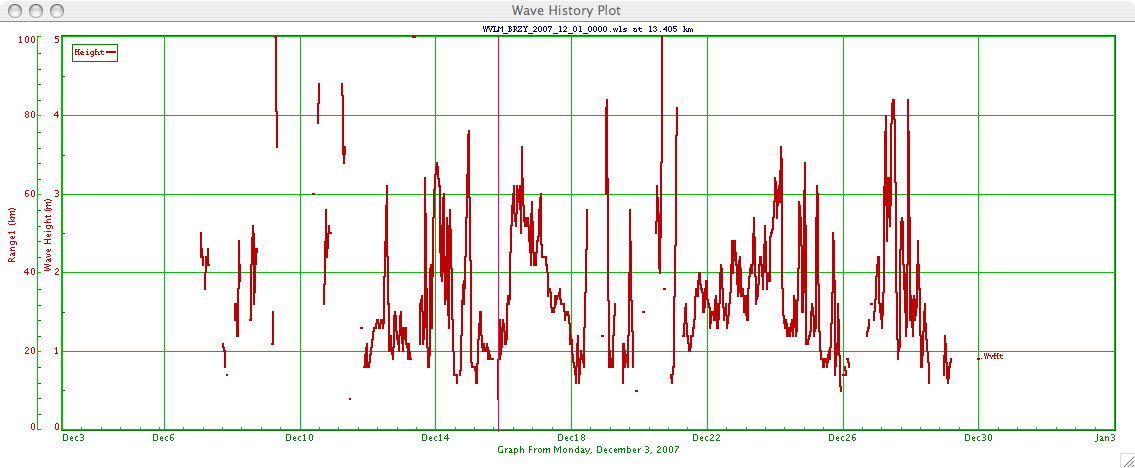
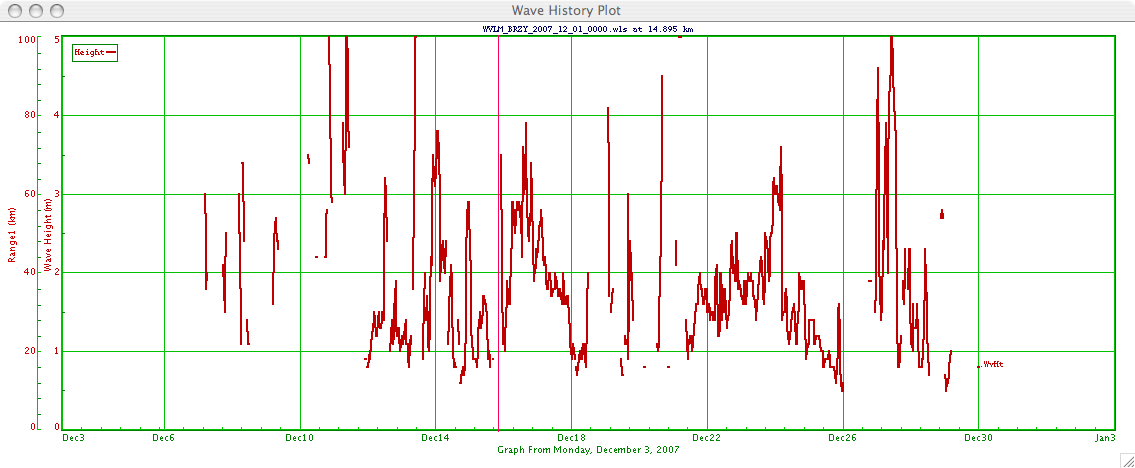
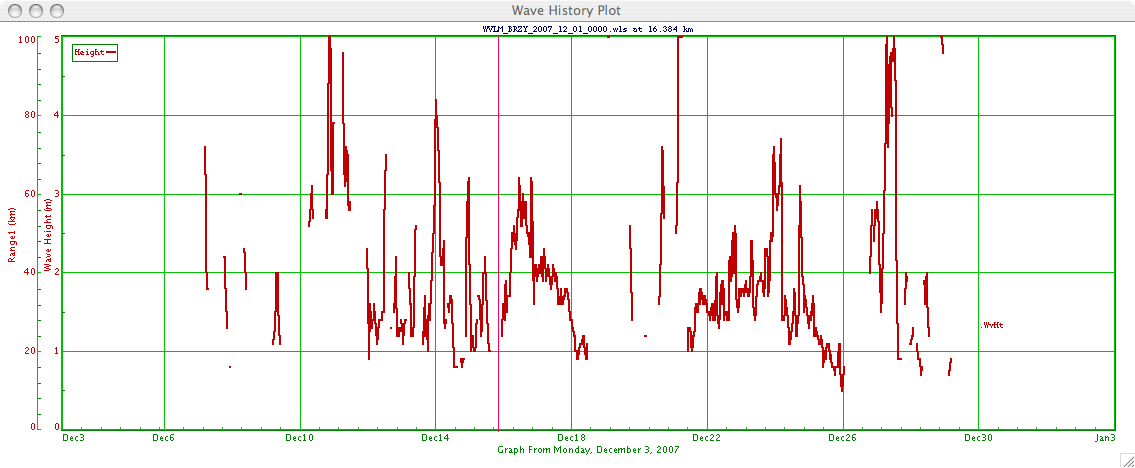
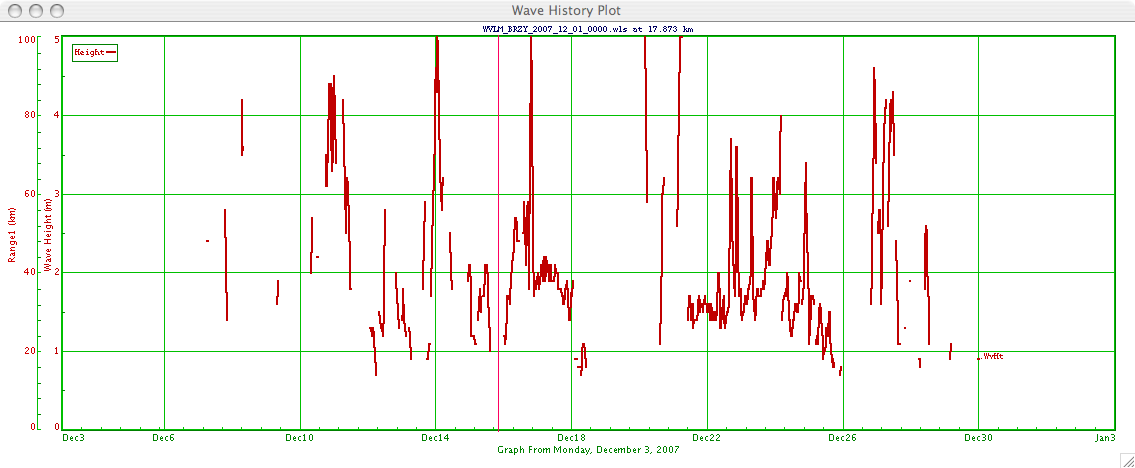
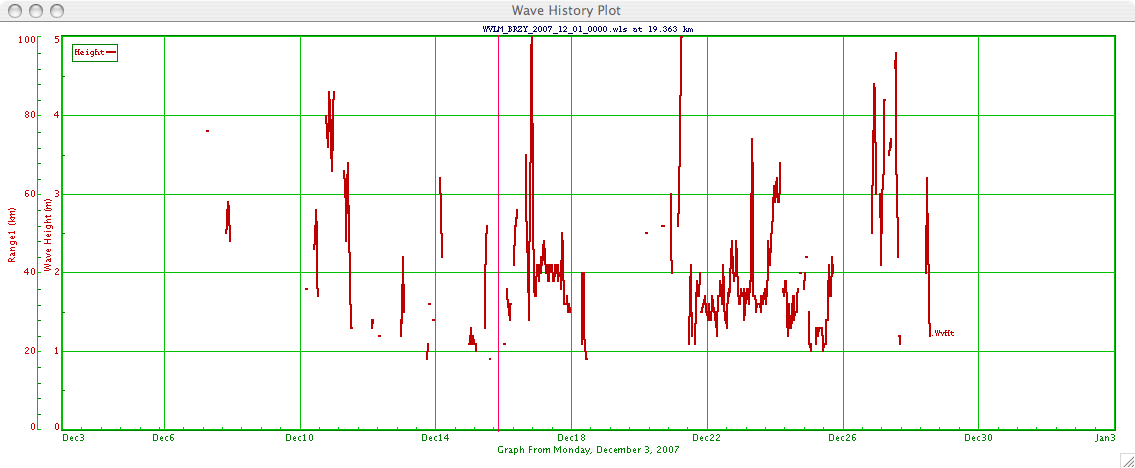
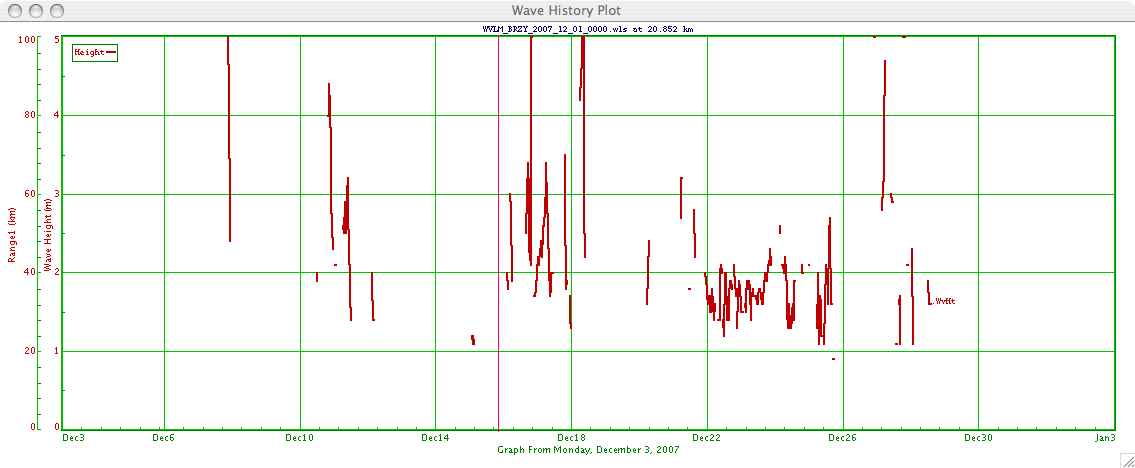
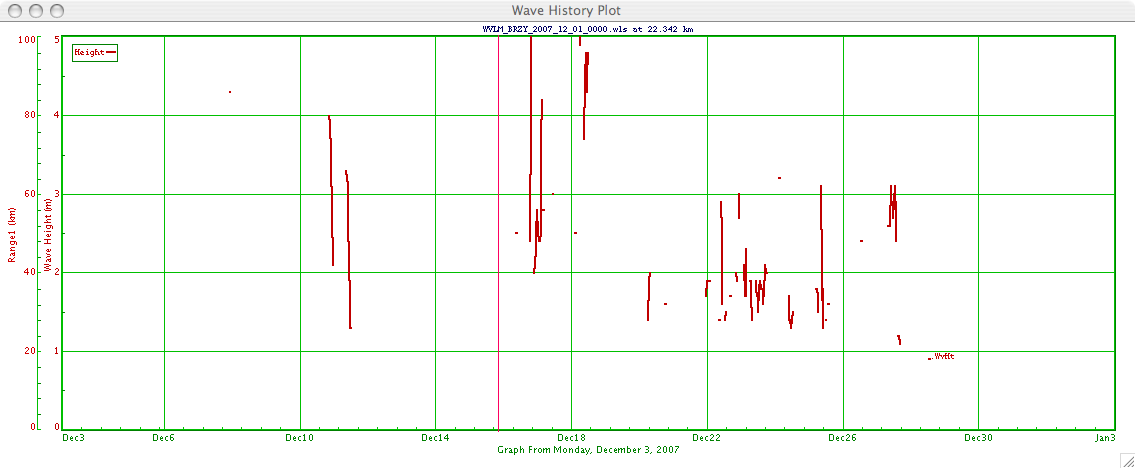
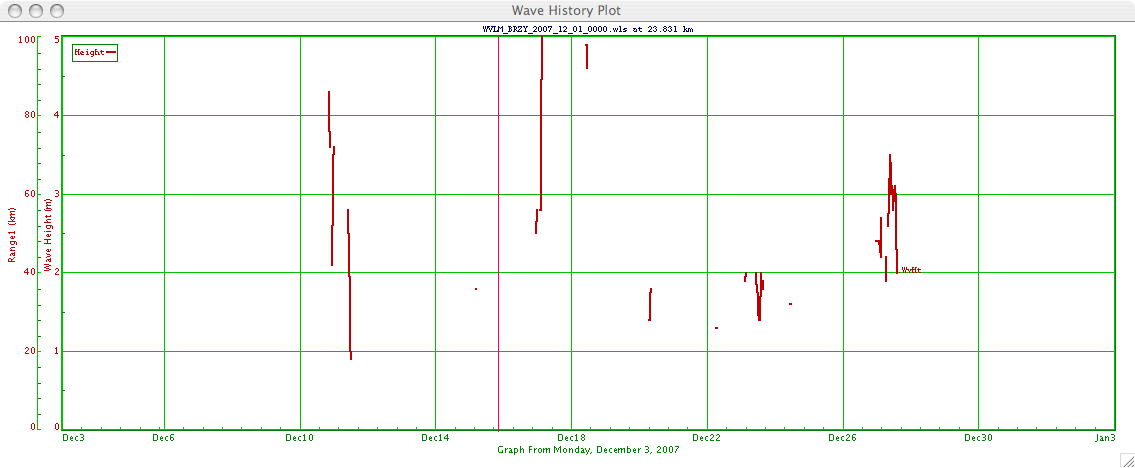
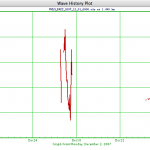
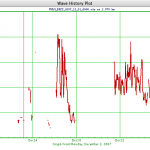
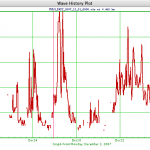
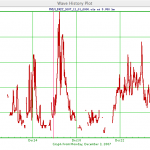
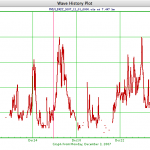
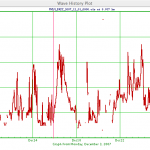
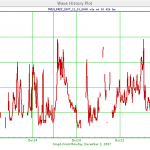
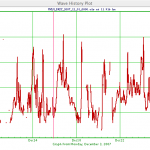
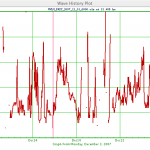
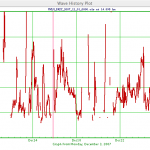
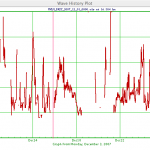
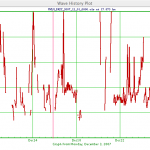
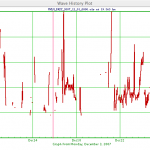
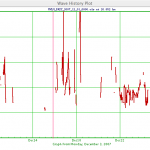
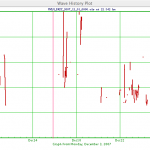
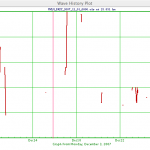
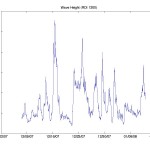
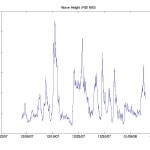
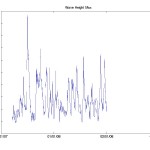
CODAR data (Wave height) for Breezy Point
Posted on July 16th, 2009 No comments-
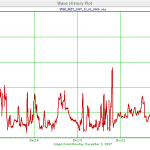
- Average Wave Heigh For Range Cell 1-16
-
- Range Cell 1
-
- Range Cell 2
-
- Range Cell 3
-
- Range Cell 4
-
- Range Cell 5
-
- Range Cell 6
-
- Range Cell 7
-
- Range Cell 8
-
- Range Cell 9
-
- Range Cell 10
-
- Range Cell 11
-
- Range Cell 12
-
- Range Cell 13
-
- Range Cell 14
-
- Range Cell 15
-
- Range Cell 16
-
- RDI 1200 Wave Hight
-

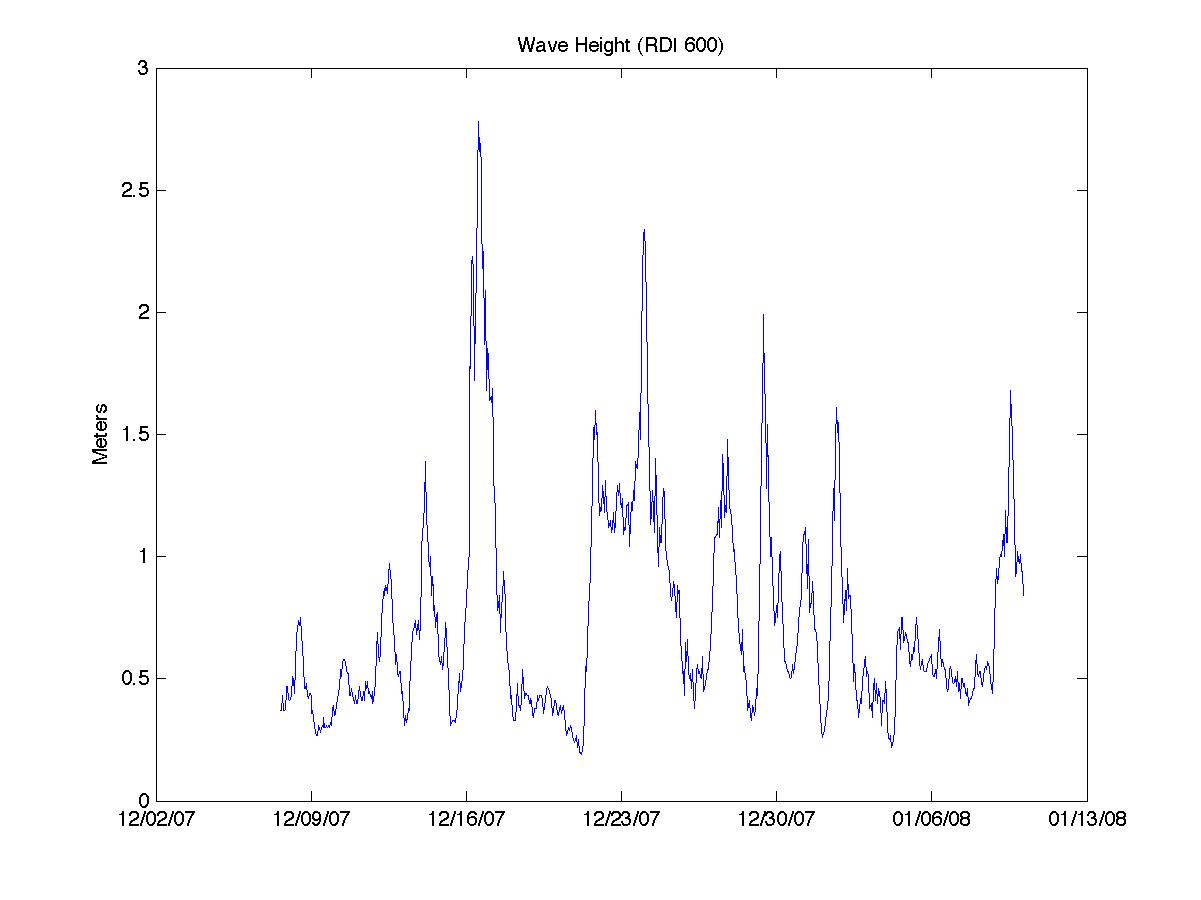
- RDI 600 Wave Height
The red plots are from the CODAR data and the blue plots are from the RDI 1200 and RDI 600.
-
-
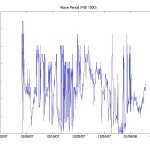
RDI 600 Plots
Posted on July 16th, 2009 No comments-
- Wave Height
-

- Peak Period
-
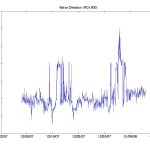
- Peak Direction
-
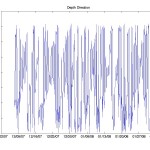
- Depth Direction
-
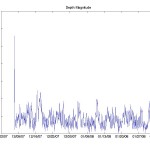
- Depth Magnitude
-
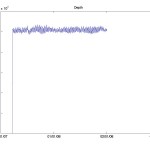
- Depth
-
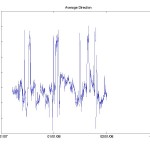
- Mean Direction
-

- Peak Period Mean
-
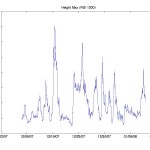
- Max Wave Height
-
-
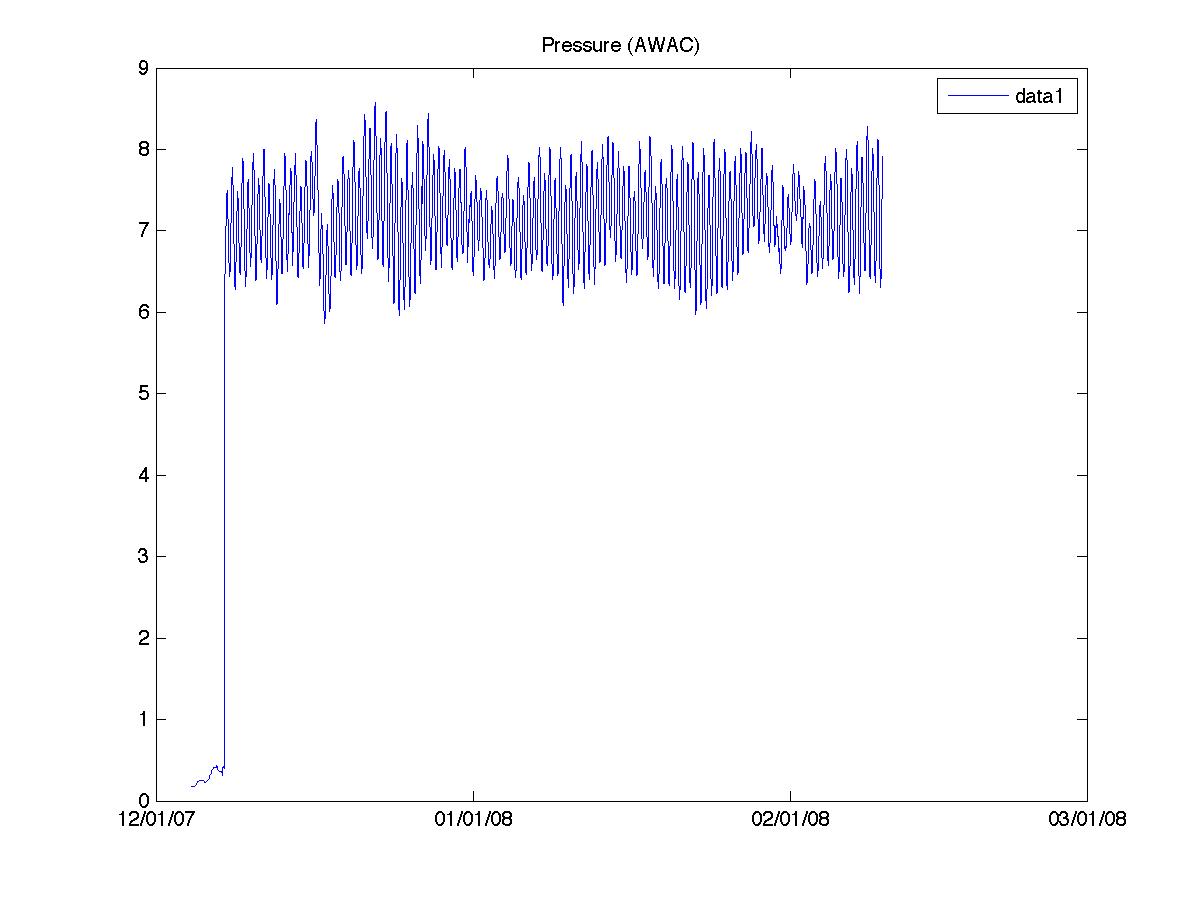
AWAC Data Plots
Posted on July 16th, 2009 No commentsPlots for the AWAC:
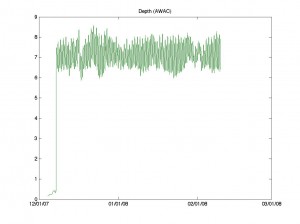
- Depth
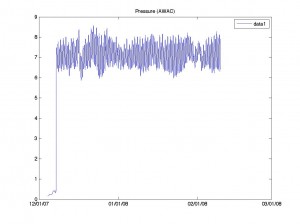
- Pressure
They were created using M
atlab vrs. 7.5
-
Plots from the RDI 1200
Posted on July 16th, 2009 No comments-
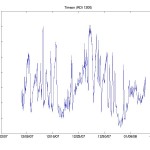
- Peak Period
-

- Peak Direction
-
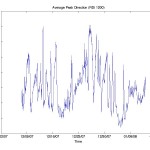
- Average Peak Direction
-

- Wave Height
-
- Wave height Maximum
-
- Average Wave direction
-

- Depth Magnitude
-
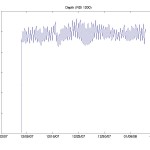
- Depth
-
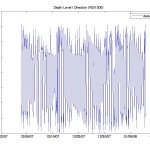
- Depth level Direction
These plots were generated using Matlab vrs. 7.5

-
-
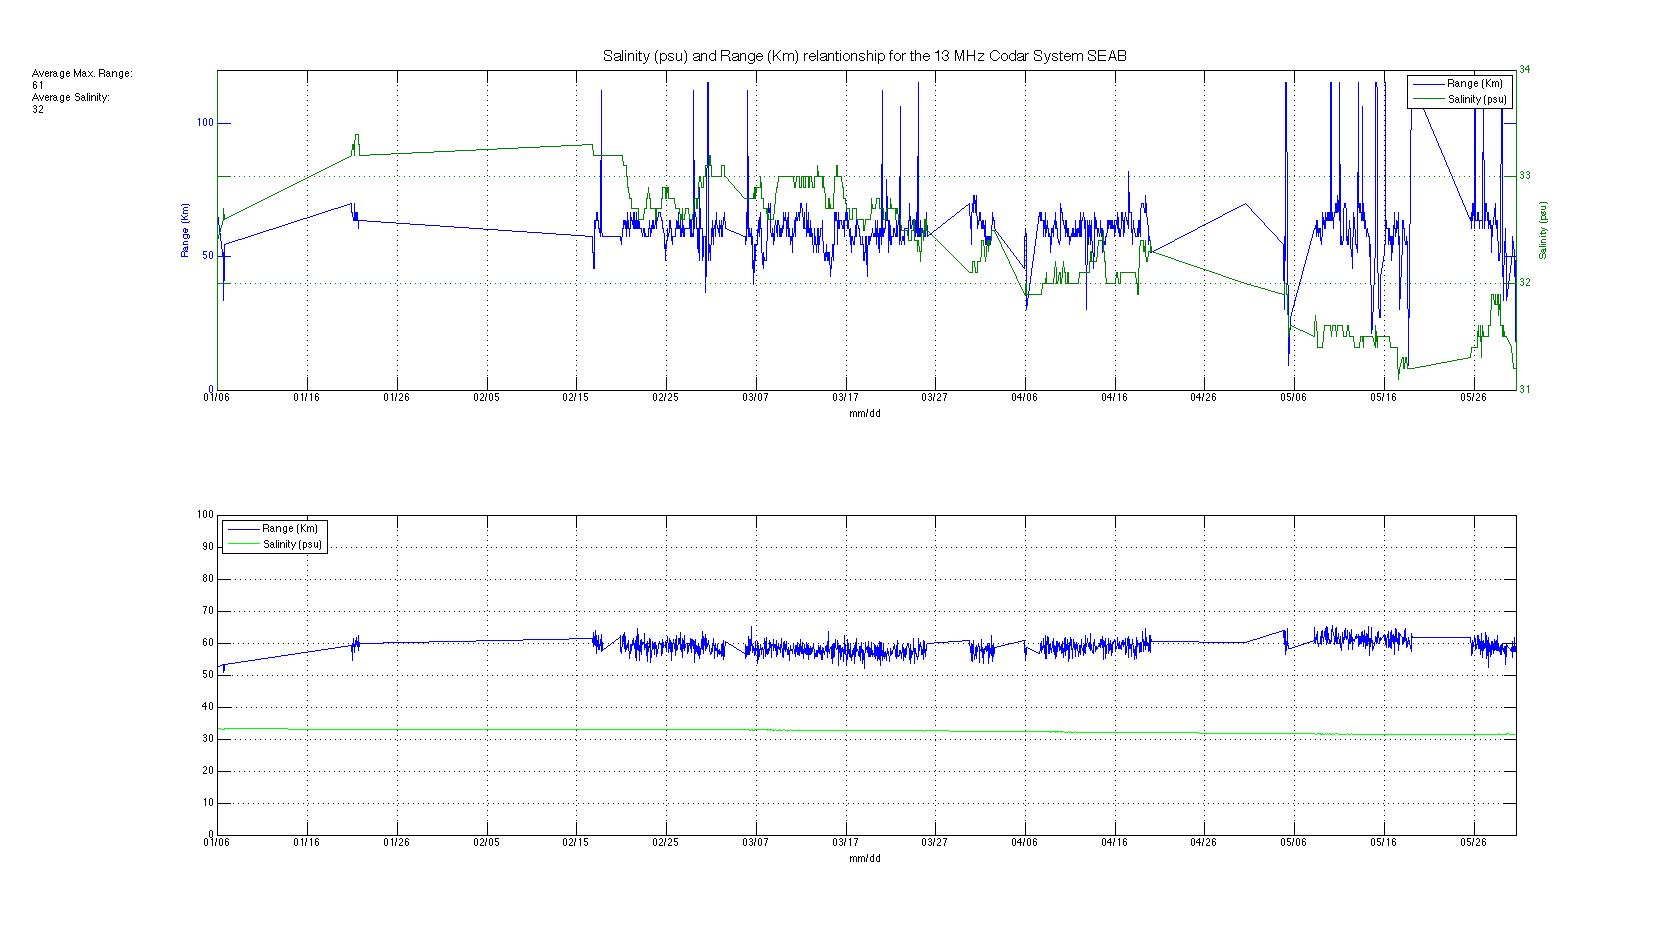
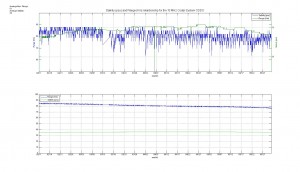
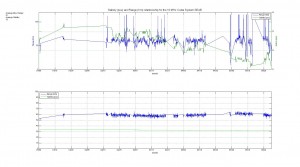
Salinity and Range Relationship for the 13 MHZ sites CDDO and SEAB
Posted on July 9th, 2009 No commentsHere are two plots of the salinity and range relationship for the two 13 MHz sites CDDO and SEAB. The first plot is the raw data and the second one is the data with a fit in it in order to appreciate better the relationship. The data for the salinity was obtained from the National Buoy Data Center. The buoy used for the CDDO site, LPRP4, is at the south-western part of the island at 23 km from the site. The buoy used for the SEAB site, 44025, is at the east part of Sea Bright at 70 km from the site. As we can see there is a little relationship between the range and the salinity. The plot for SEAB presents better this relationship. In it we can see that in some days the salinity decreases and the range follows the same behavior. But at the same time if we take a look of the whole situation there are days when this relationship is not presented. As a conclusion we can state that the CDDO site has a higher salinity in its water with a higher range ( averg. Salinity = 36 psu, averg. Range = 81 Km) than the SEAB site (averg. Salinity = 32 psu, averg. Range = 61 Km). Both sites have a very constant salinity and range. This situation still needs to be look more closely because a change in salinity of 4 psu, its unusual to produce a difference of 20 km in range. Maybe closer data to both site would give us a better understanding of the relationship there is between this two variables.
-
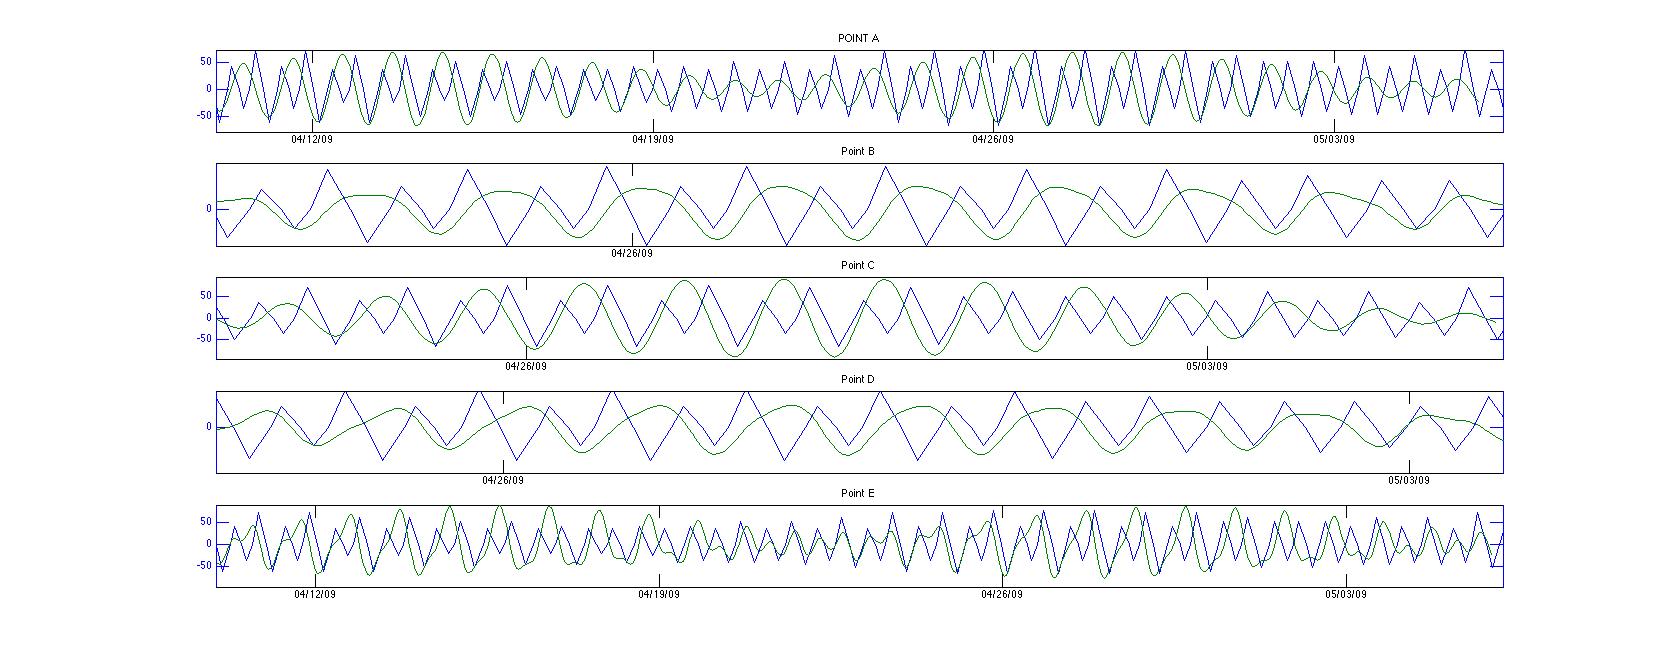
Puerto Rico CDDO Tidal Analysis 2
Posted on July 8th, 2009 No commentsTidal Analysis 2 follows a similar approach to the one posted previously but with a few modifications. Three points were selected for comparison: Point A corresponds to range cell #1, Point B corresponds to range cell #2 and so on. This consequently provides a reasonable improvement in terms of proximity to the NOAA station. Also, a larger time series significantly enhanced the performance of T_tides algorithm – the previous analysis was based on one month of data, while this one uses four months of data. Calculated tidal constituents (O1, K1, M2, S2) remained unchanged.
Results:
Note that Both cycles are in phase.
Considering that radial data is limited by what the radar can perceive in a radial direction, discrepancy between current velocity magnitudes is to be expected.
-
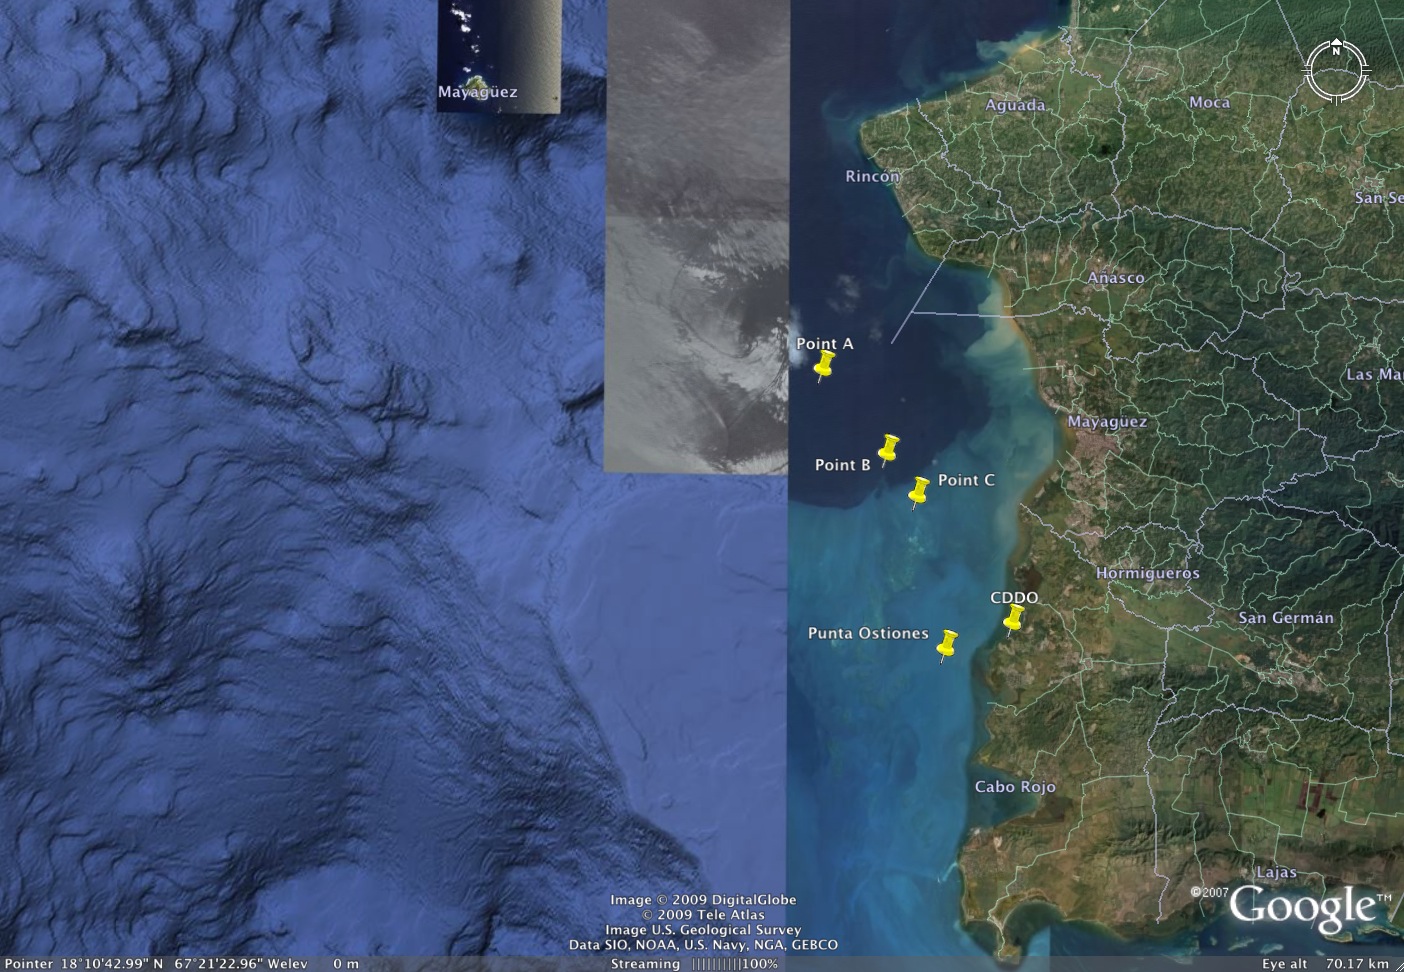
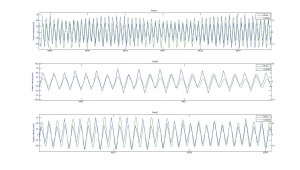
Puerto Rico CDDO Tidal Analysis
Posted on July 6th, 2009 No commentsThis figure shows the five points selected for comparison. They are spaced at10km intervals and at a 325˚ heading from the CDDO site. They were chosen because they provide a great deal of information regarding the v (north south) component, which is the predominant flow component along the west coast of the island.
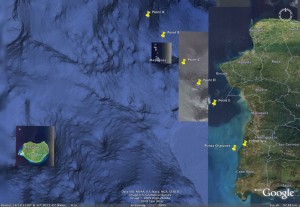
Radial data was gathered from the CDDO site in Puerto Rico for the month of April. This data was subsequently analyzed using Rich Pawlowicz’s T_Tides Matlab toolbox. The following figure illustrates the CODAR output (shown in green) for a set of five points located in the Mona channel against Punta Ostiones tidal current predictions by NOAA (shown in blue). V (north-south) current velocity component was used for comparison.
It is known that tides along the west coast of Puerto Rico are semidiurnal. However, T_tides is only calculating the diurnal component of the observed tides. This may be due the fact that T_tides is currently set to calculate only 4 Tidal constituents: O1, K1, M2, S2, which might not be the most influential constituents in this particular area of the world. Nevertheless both data sets seem to be in considerable agreement, when the semidiurnal component is ignored.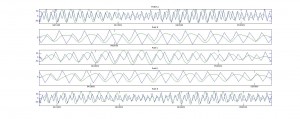
It is important to note that CODAR output was initially compared with NOAA’s sea level observations at Mayaguez. This however, yielded inconclusive results.
-
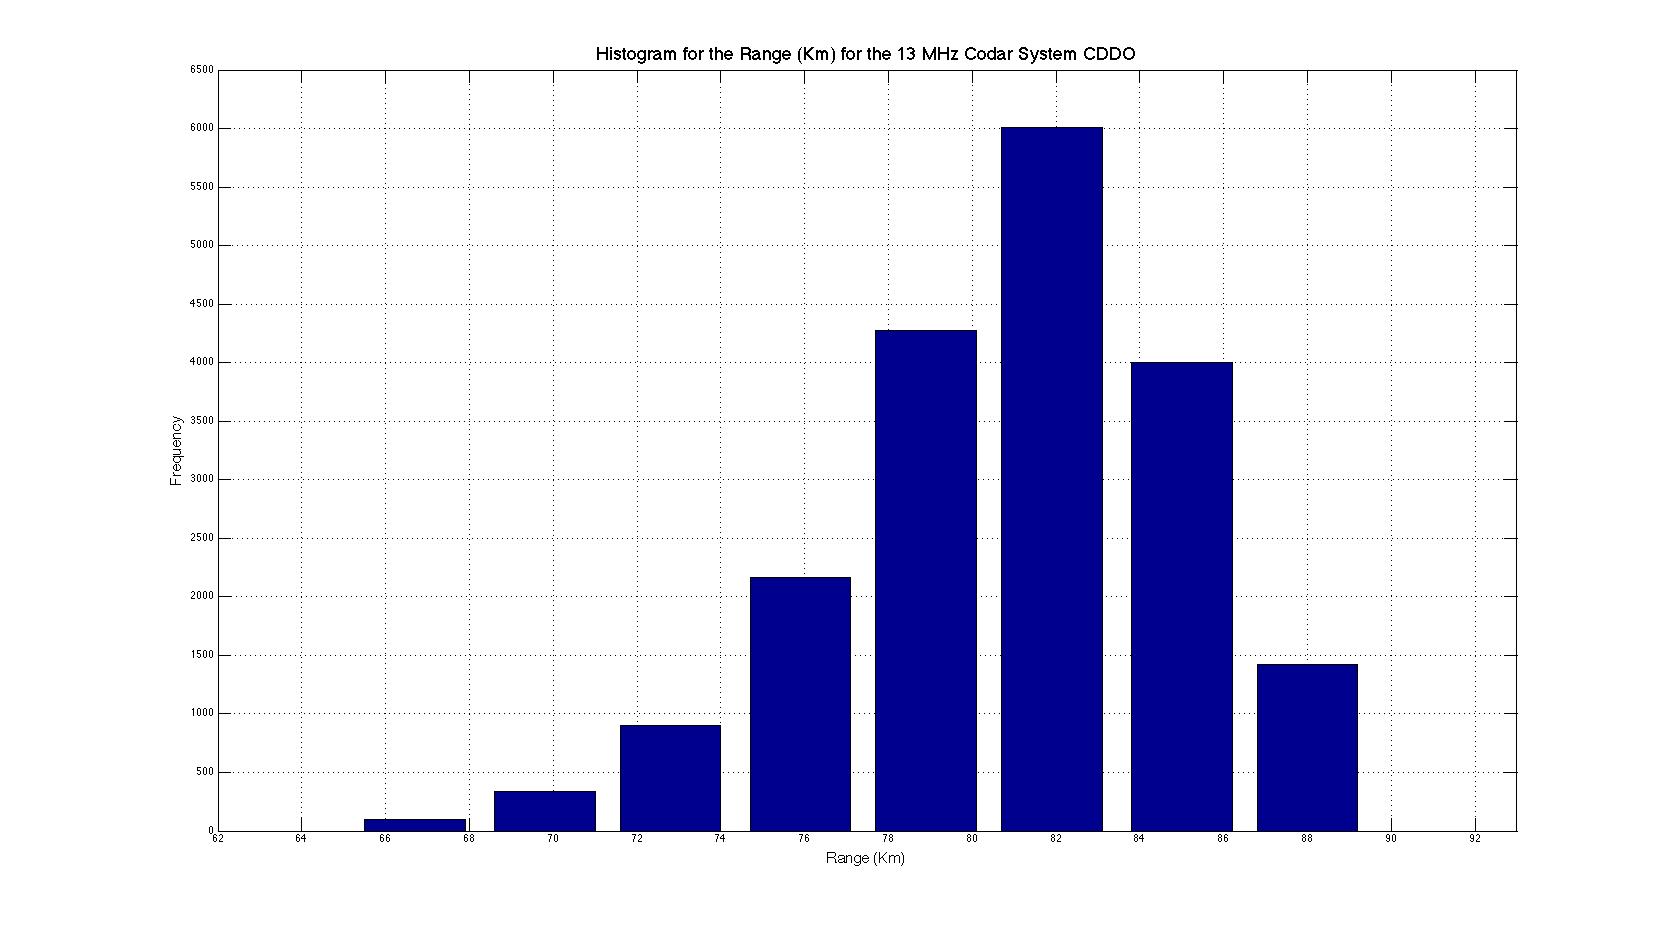
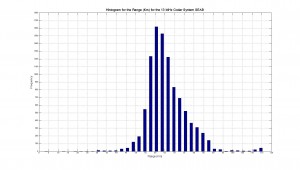
Histogram of Range (Km) for the 13 MHz Codar Systems CDDO and SEAB
Posted on July 1st, 2009 No commentsThe histograms plotted were done using the radial diagnostic files from the CDDO and the SEAB 13 MHz sites. It can be appreciated from the histograms that the CDDO site has a frequency of having a larger range than the SEAB. According to the theory both sites must have similar average range values, since both of them operate at the same frequency. The difference in range between these two sites can be due to external factors such as noise interfering with the signal, lost of power, sea surface salinity, etc. The SEAB site has a range with the highest frequency value between 60 – 63 Km, while the CDDO has a 81-83 Km. The theory states that a water with a high salinity will prolong more the signal that a water with low salinity. If we look briefly at the values of salinity for CDDO ( 35 ppt) and for SEAB (32 ppt) we can expect this results. In conclusion when compare to the CDDO site with the SEAB site, it seems to be working properly, and having a good constant range.

-
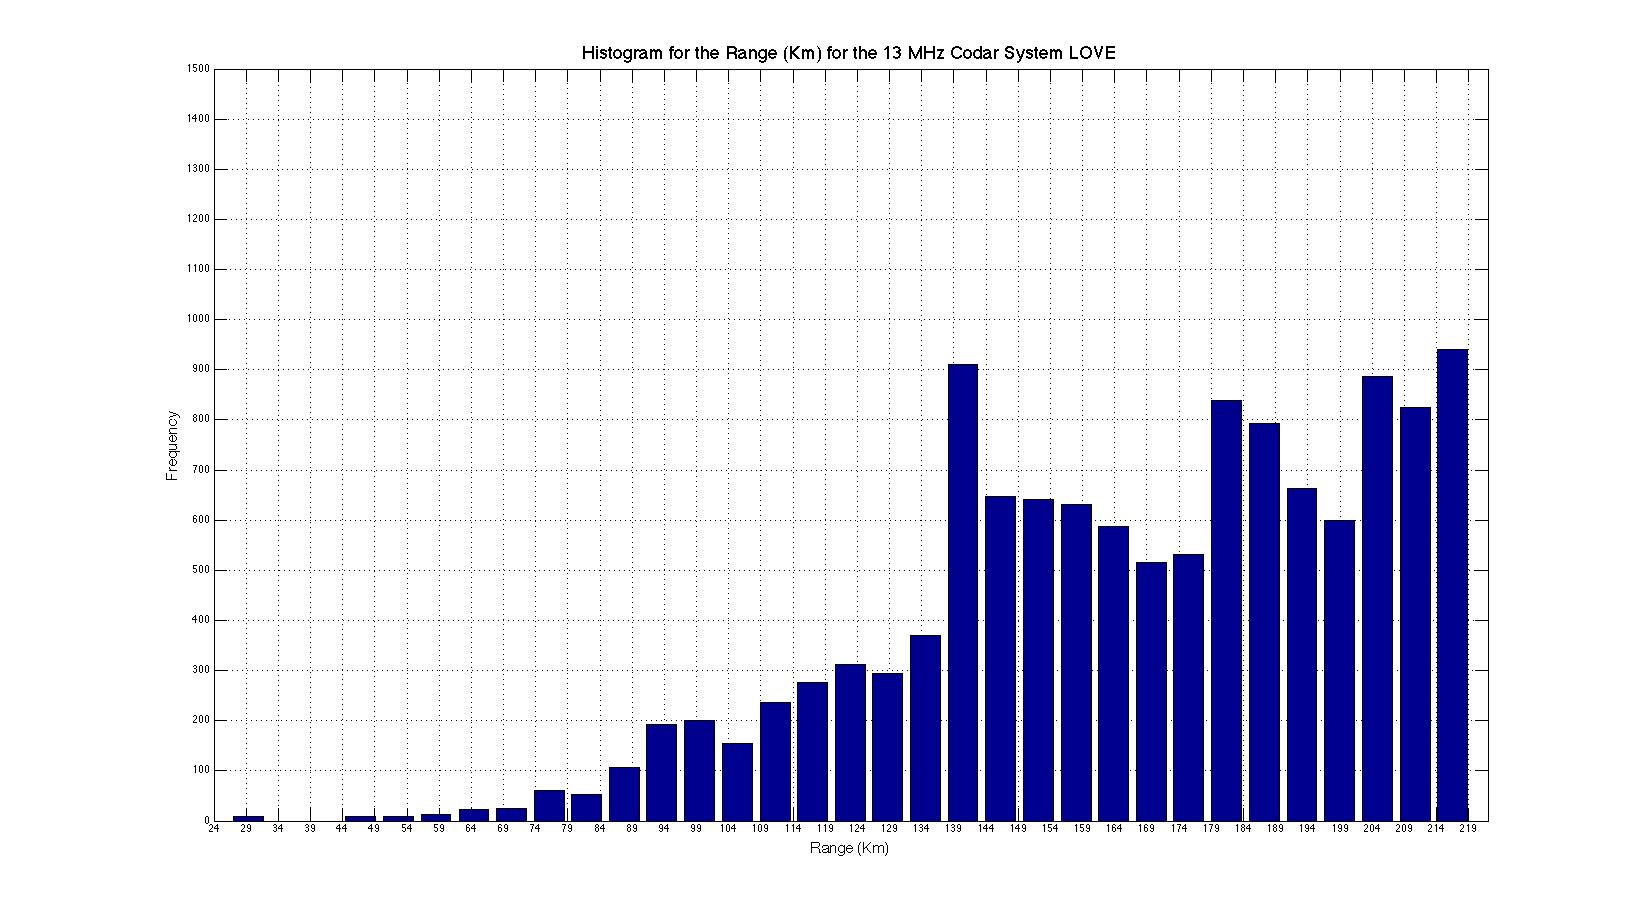
Histogram of Range (Km) for the 13 MHz Codar System CDDO and the 5 MHz Codar System LOVE
Posted on June 26th, 2009 No commentsThe histograms plotted were done using the radial diagnostic files from the CDDO 13 MHz site and from the LOVE 5 MHz site. The difference in range is clearly visible and the data is coherent with the theory. The theory states that the lower the frequency the higher the range but at the same time the less resolution of the data. We can appreciate that the 13 MHz codar system CDDO clearly has a lower range than the 5 MHz LOVE site, being this coherent with the theory.