


-
Out with the old in with the new
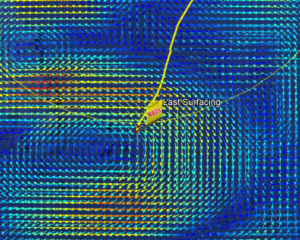
Posted on September 15th, 2018 No commentsToday RU 29 (finally) made it out of the Sri Lankan maritime border and is on its way to conquer a whirlwind of a situation. Naval ocean model HYCOM and NOAA ocean model RTOFS (depicted in Google Earth overlay figure below) picked up on an eddy spanning over 250 mi in width 400 mi in length that RU29 must cross in order to reach Mauritius off the coast of Africa. The glider may encounter surface velocities measuring from 0 to 0.3 m/s, with the highest velocities propelling the glider on its projected course.
-
Sept 11 Sentinel Glider Tour
Posted on September 14th, 2018 No commentsA first tour of the Hurricane Sentinel Glider Fleet on Sept 11 as Florence was still approaching and a comparison to the operational models. Note that the data was transmitted over the GTS so it was available for assimilation in the models. All plots were prepared by Maria Aristizabal.
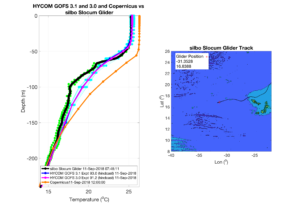
The first picket line is off Africa in the formation zone where the north-south extent is relatively narrow.
TWR Glider SILBO indicates the GOFS models are getting the surface layer quite well. All models miss the colder temperature layer near 100 m, but all are back in good agreement between 150 and 200 m.
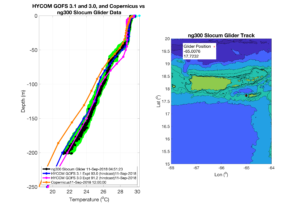
Second picket line. The Caribbean and Tropical Atlantic.
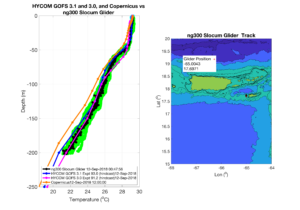
First is the station keeping Navy Glider NG300. GOFS models doing well, especially GOFS 3.1
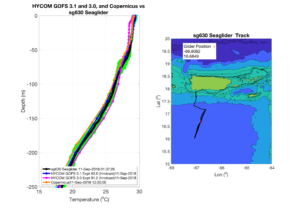
Next is the AOML Glider SG630 occupying the transect south of PR. All models agree well.
Then the third picket line protecting the US Mainland.
Gulf of Mexico first.
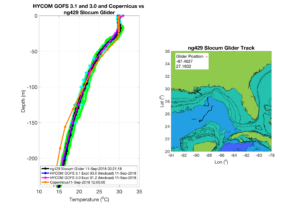
Navy Glider NG429 is in deepwater. GOFS models do well in deepwater.
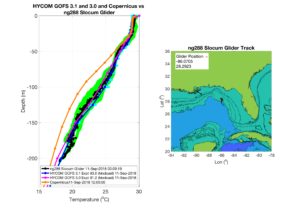
Navy Glider NG288 is on the outer shelf. Not only do GOFS models do well, GOFS 3.1 even matches some of the curves in the profile. Data assimilation might be doing very well here.
Now South Atlantic Bight
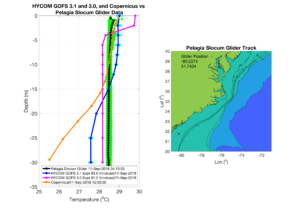
Skidaway Institute of Oceanography glider PELAGIA. We have told this story before. GOFS 3.0 is closest, but it might be for the wrong reasons. GOFS 3.1 is designed to have more vertical resolution in shallow water, and PELAGIA is definitely in shallow water.
Into the Mid Atlantic Bight.
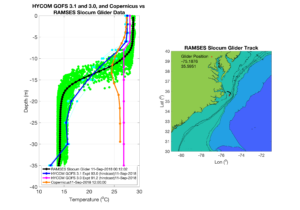
Here is RAMSES, the UNC glider operated by SIO for the NSF PEACH program. An early favorite in the reporting. Here is where GOFS 3.1 shines bright even in shallow water.
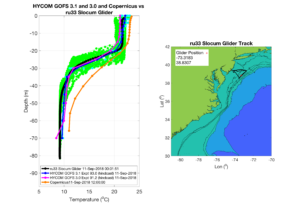
Moving north, we find Rutgers glider RU33 running along the shelf break. We are on the deeper side of the shelf. The Stratification Factor maps showed that both GOFS 3.0 and 3.1 were stratified on the outer shelf, and that is what this comparison demonstrates.
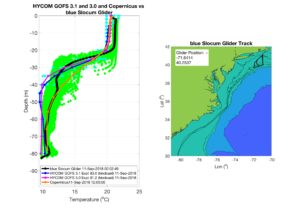
Continuing north to UMass Glider BLUE, we see a complicated structure at mid shelf that no model likes. Copernicus seems to lock onto the profile sooner, near 40 m.
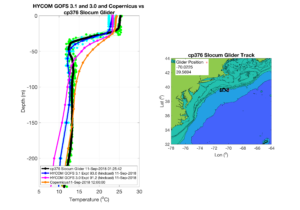
One final step north, we move on to the NSF OOI Coastal Pioneer Glider CP376. Another profile that no model seems to like, even with this glider in deepwater. Surface temperatures are off. GOFS 3.1 is good at getting the near surface variation. Copernicus is good at getting the deep variation.
-
Isothermal shelf waters and Florence
Posted on September 14th, 2018 No commentsFlorence is approaching Wilmington NC as a category 1 storm according to the National Hurricane Center https://www.nhc.noaa.gov/text/refresh/MIATCDAT1+shtml/140842.shtml
It’s slowed down significantly and is still sitting over warm coastal ocean waters. Glider data profiles from RAMSES to the north of Florence and PELAGIA to the south of Florence in previous posts have shown that the continental shelf of the South Atlantic Bight is isothermal, or uniformly warm from top to bottom. Additionally, with the approach angle of Florence winds look to be downwelling favorable meaning that any cold bottom water on the outer shelf was or is likely being advected offshore, while warm surface water is potentially being advected onshore.
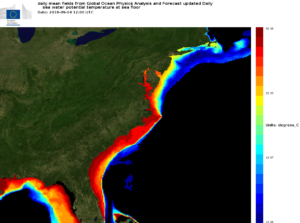
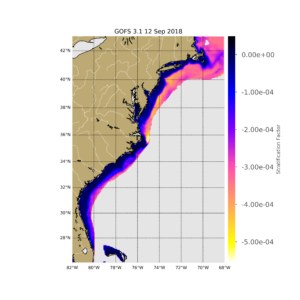
This means that despite vigorous mixing in the coastal ocean there is not likely to be any ocean cooling on the shelf, as there simply isn’t any cold water available to mix to the surface. Bottom temperatures from the European Mercator model show warm bottom temperatures across the entire SAB in contrast to the cold bottom temperatures in the MAB.
Florence has been a slow moving storm over the continental shelf and with little ocean cooling these warm waters will likely not help weaken the storm.
A new batch of glider profiles are coming in this morning to confirm this, but overall this highlights the large differences in regional coastal ocean water masses and highlights processes that we’ll want to investigate in the coming years to better understand how coastal oceans affect storm intensity ahead of landfall.
-
Anchors aweigh!
Posted on September 13th, 2018 No comments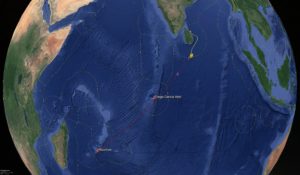
RU 29 has officially left Sri Lanka on August 12, 2018. Operating at a standard safe speed of 20 km per day RU 29 is scheduled to arrive at Mauritius, roughly 4,300 km away, in early March. The glider was granted scientific permission to enter British Indian Ocean Territory and anticipated to come within 50 miles off of the Diego Garcia Atoll. With this mission we will see exactly how well our global forecast models predict the variability in the Indian Ocean and what are the optimal paths for gliders to maximize their forecasting impact among other fascinating scientific discoveries that may occur throughout our journey. Stay tuned.
-
Hurricane Glider Picket Lines
Posted on September 13th, 2018 No commentsHere is the evolving figure for the Hurricane Glider Picket Lines. It was just submitted as a placeholder to the OceanObs19 white paper entitled OceanGliders: a component of GOOS. The final figure is due in October. Other suggestions welcomed.
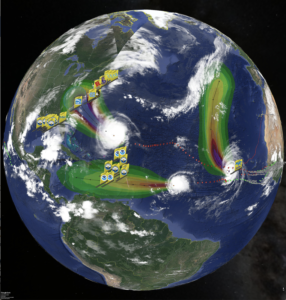
Caption:
Hurricane Florence, Isaac and Helene cloudtops (left to right) on September 11, 2018, with NHC best tracks behind each hurricane, NHC probability of tropical storm force winds ahead of each hurricane, and the tails of the diverse fleet of ocean gliders in the picket lines transmitting upper ocean data in near-real time to forecasters.
-
Gliders NG330 & SG630 in the Caribbean
Posted on September 13th, 2018 No commentsNow standard glider data/operational model comparison plots for the Caribbean hours ahead of Isaac. First is Navy Glider NG300 station keeping west of St. Croix.
Second is the NOAA AOML Seaglider SG630 running the north-south transect on the southern side of Puerto Rico.

As we discovered over the last few days, all the operational models are doing fairly well in this region. GOFS 3.1 has been a consistent good performer.
The issue we now want to investigate in the Caribbean is salinity. Our focus for this first week of work has been temperature, to see how we are doing with heat content before the storms arrive. Salinity has an important impact during the storm, specifically, the fresh water layers we expect to see near the surface that inhibit mixing.
-
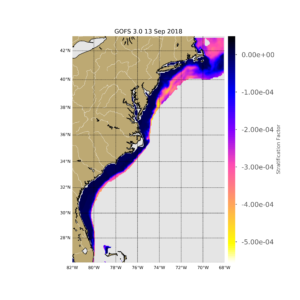
Stratification Factor Maps
Posted on September 13th, 2018 No commentsBelow is today’s Stratification Factor map for GOFS 3.1. Very little stratification in the South Atlantic Bight, much larger stratification in the Middle Atlantic Bight especially from midshelf and beyond. Light colors are strong stratification, dark colors are weak stratification.
Stratification in GOFS 3.0 is significantly reduced in both the SAB and MAB.
-
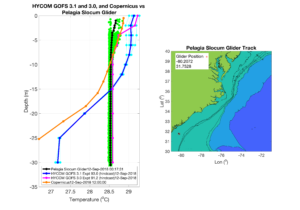
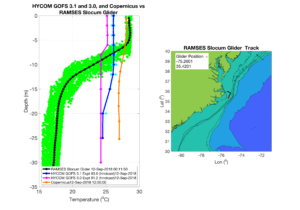
Gliders Pelagia and Ramses
Posted on September 13th, 2018 No commentsHere are glider data-model comparisons for the two gliders being flown by Catherine Edwards at Skidaway.
Pelagia is located near the SC/GA border and is nearly isothermal but with the daily variation in temperature near the surface averaging to a small increase in the daily average temperature. GOFS 3.1 has the least vertical variability.
Ramses deployed north of Cape Hatteras indicates there is strong two-layer system with significant stratification, and GOFS 3.1 is doing the best job of capturing it.
From Maria:
“It is interesting to see that for Ramses the water column is very stratified, with a surface to bottom temperature difference of about 12 degrees celsius, but some of the models show weak stratification (about 1 degree surface to bottom temperature differences). For Pelagia the situation is completely opposite: the temperature is almost vertically uniform but the models present some stratification.”
-
SAB & MAB Stratification in GOFS 3.1
Posted on September 12th, 2018 No commentsWe use the Non-dimensional Potential Energy Anomaly, what we call the Stratification Factor, to represent the stratification structure on the continental shelf with one number so we can plot it as a map.
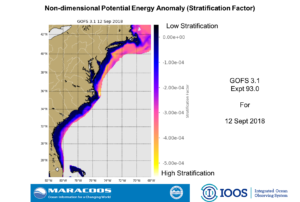
This first plot says that according to GOFS 3.1, the MAB shelf is highly stratified and the SAB shelf is much less stratified.
You can even see the very high stratification in the PEACH area just north of Cape Hatteras.
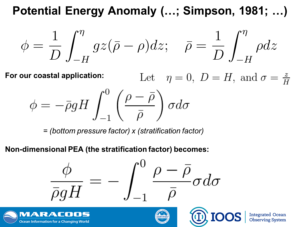
The first slide is the derivation of the Stratification Factor, and the second slide shows the current conditions in 3.1
Thanks.
Scott
-
OOI Gliders in the Glider DAC
Posted on September 12th, 2018 No commentsHere are 3 maps people may find useful for their daily briefs.
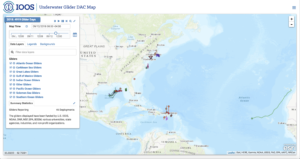
First image is the IOOS Glider DAC showing the entire North Atlantic fleet.
The change from yesterday is the NSF OOI gliders are back in. Yesterday afternoon Mike Crowley worked on resolving the metadata issues and John Kerfoot was able to get the OOI Pioneer Array gliders back into the DAC. So now this NSF OOI data is also going to the DAC and onto the GTS and into the models.
This image is an unprecendented combination of NOAA, Navy, NSF and Industry (TWR’s glider SILBO in Helene) supported gliders all collaborating through the IOOS Glider DAC to support our Weather-Ready Nation’s efforts to be better prepared for hurricanes.
Its inspiring, but with my own memories of Sandy, still difficult knowing what is in store for the southeast.
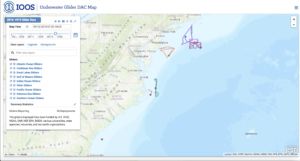
Second image zooms into the East Coast picket line, where you can now see the individual OOI gliders that were added to the mix last night.
The line up from south to north is
Catherine Edwards PELIGIA deployed for SECOORA.
Catherine Edwards deployed UNC RAMSES for NSF PEACH.
NOAA Spray
Travis Miles RU33
Wendell Brown UMass BLUE.
NSF OOI.
I know this is a glider distribution list, but there is a similar level of involvement in the IOOS HF Radar community.
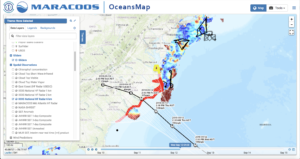
Third image is from the MARACOOS OceansMap were we have taken the IOOS Glider DAC gliders, added the NHC Florence forecast cone, and also turned on the IOOS National HF Radar network 6 km grid (as you see in the menu on the left).
In the MAB, it was the combination of the gliders, the HFR, the satellites, and the 30-year time series of NDBC buoy data that made possible the scientific analysis and essential ocean process discovery that led to the science papers that provided the scientific basis for the change in approach that we see active today.
Thanks to the long list of people that worked with increasing intensity for months so that this array can be in place.
We will be looking at more gliders in the model data comparisons today. If anyone needs something special, let me know, and we will jump it in the queue.
Thanks all. Stay safe.
Scott
