Information
Sargassum seaweed is an invasive species of microalgae that floats on the ocean surface. Because the seaweed does not sink to the ocean floor its movement is dependent upon ocean currents. It is thought to come from the Sargasso Sea which is estimeated to hold up to 10 million metric tons of Sargassum, but there is still much unkonwn about the seaweed. In recent years there has been a massive influx of the seaweed into the Carribean and it has caused a number of different issues. Most notbaly the seaweed clusters together, washes ashore, and decomposes, adversely affecting the toruism industry.
Project
The process for tracking and predicting Sargassum seaweed is still under development but has taken priority due to the record high bloom of the seaweed this year. The original process entailed utilizing images of floating algae density maps (Figure 1), provided by the University of Southern Florida’s Optical Oceanography Laboratory, and running these images through an image processing algorithm that identified and clustered the higher concentrations of floating algae. The points with the greatest potential of being Sargassum seaweed were then identified. The latitude and longitude for the centroids of the clusters are used as starting locations for virtual drifter particles. The virtual particles are then advected using the HF Radar network or the AMSEAS model. The images use raw satellite data and USF’s floating algae index (FAI) to identify floating algae and other materials on the ocean surface.
The process in its current stage utilizes the Alternate Floating Algae Index (AFAI) via the University of Southern Florida's Optical Oceanography Laboratory. These data products have better spatial resolution providing more accurate readings. However the AFAI has drawbacks with numerous data gaps due to a number of factors related to the area and the satelites abilities. After the initial figure is loaded into our image processing algorithem the process stays relatively the same, with minor fine tuning, yelding a higher resolution, more accurate product.
Moving forward we will be incorporating the HF Radar Network in and around Puerto Rico into our system in a more constructive way, as well as creating a warning system to give notice of when Sargassum comes within 5 miles of the coast of selected areas. The warning system will focus around areas established HF Radar stations exist where their data can be utilized in conjunction with different ocean current models.
Data Products
A history of the drifter models for the southern coast of Puerto Rico can be accessed here.
A history of the Sargassum tracking/prediction model of Puerto Rico incorporating the image processing algorithem can be accessed here.
Process
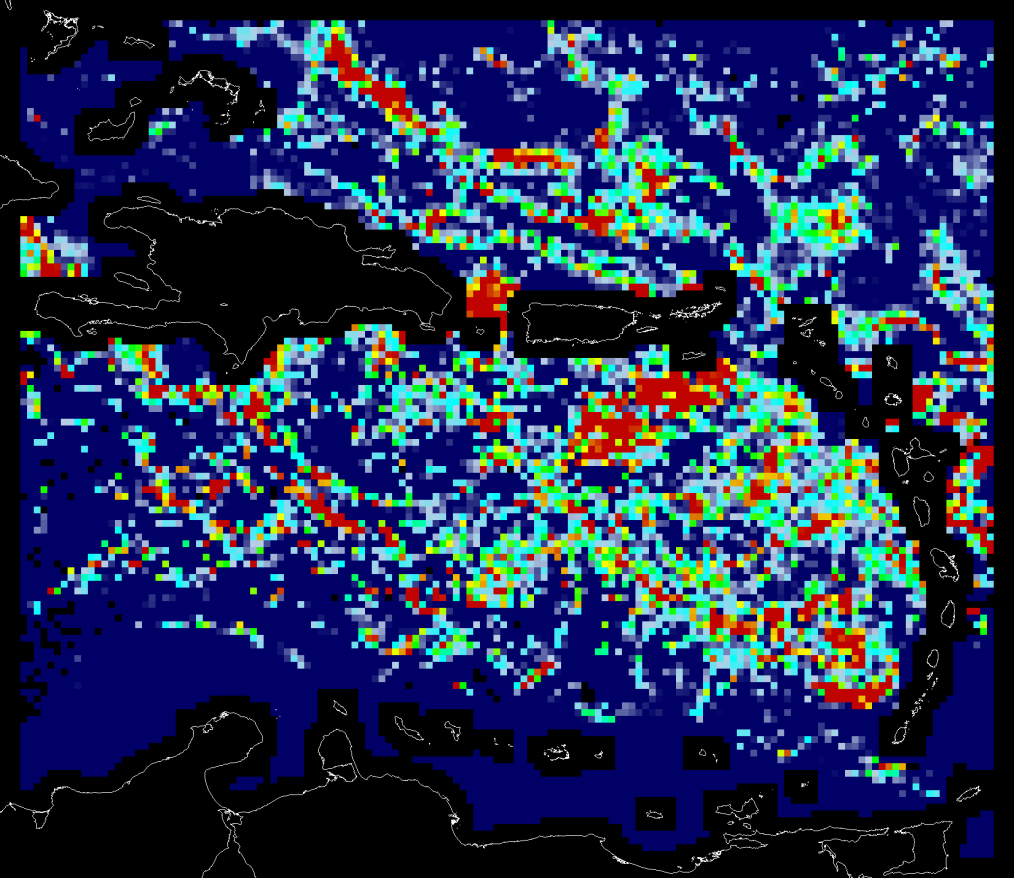
Figure 1
Floating alage density map (06/15/18) in terms of percentage area cover via University of Southern Florida’s Optical Oceanography Laboratory
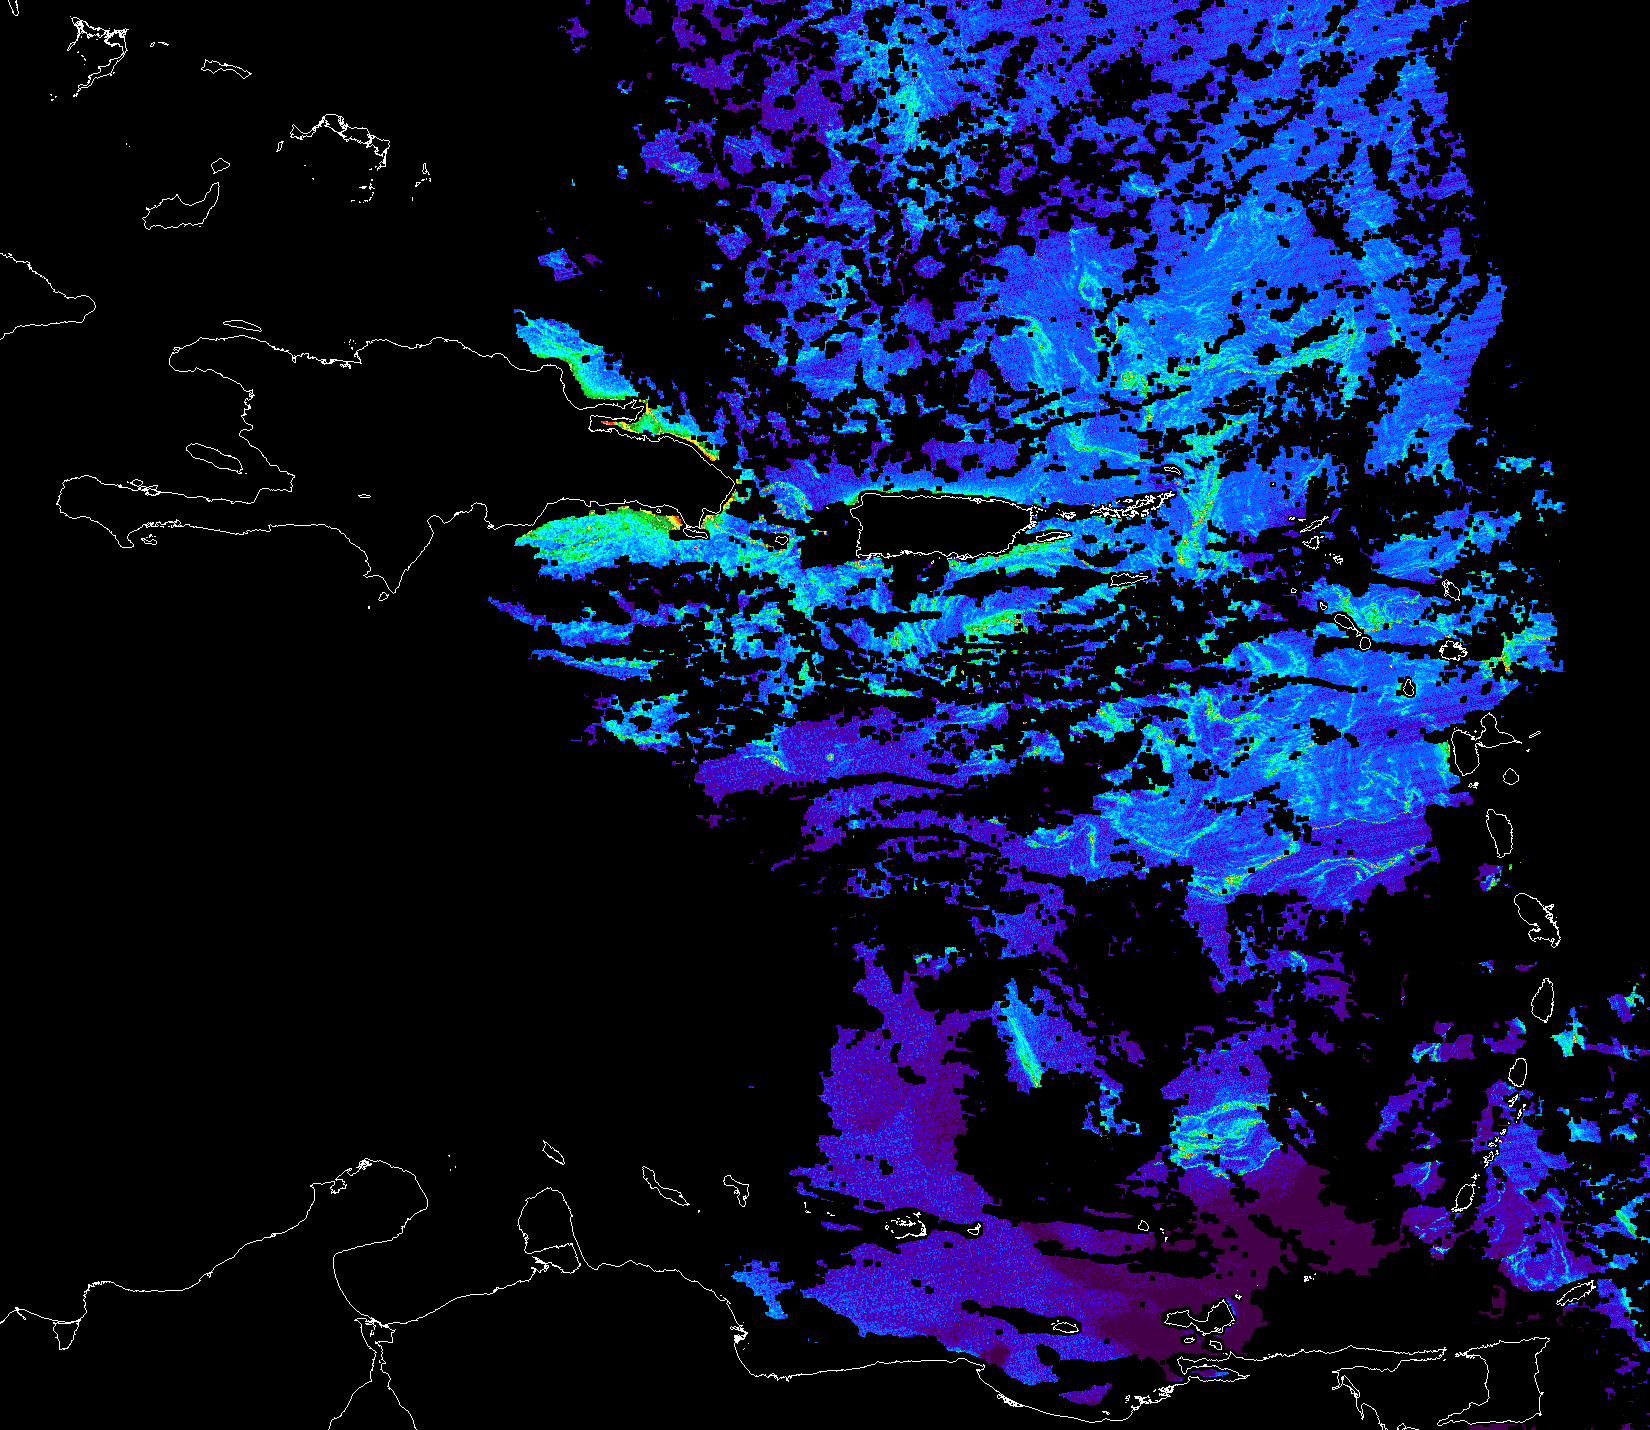
Figure 1B
Alternate Floating Alage Index map (06/15/18 16:54 GMT) in terms of percentage area cover via University of Southern Florida’s Optical Oceanography Laboratory
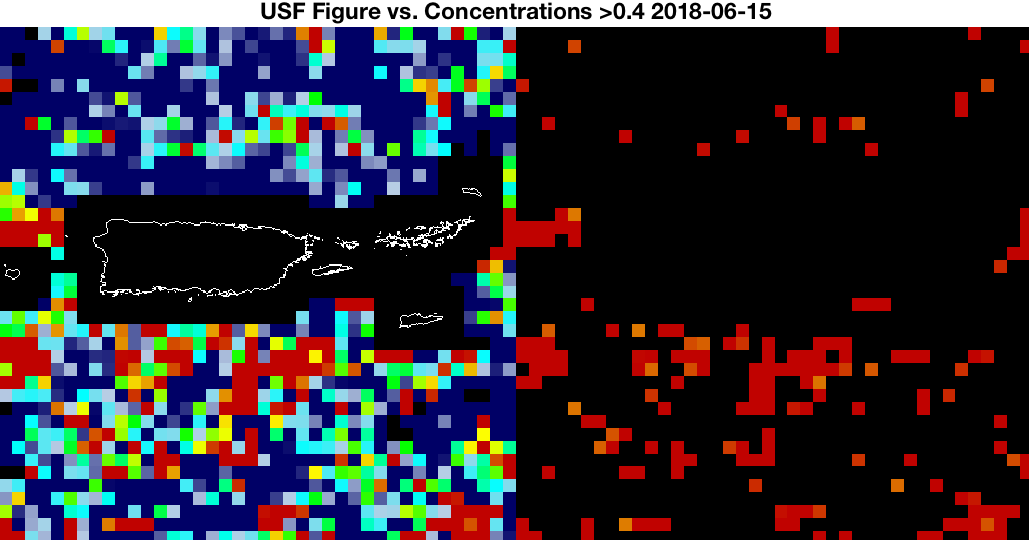
Figure 2A
Floating algae density map (left), density map after first set of image processing to determine higher concentration areas of Sargassum (right)
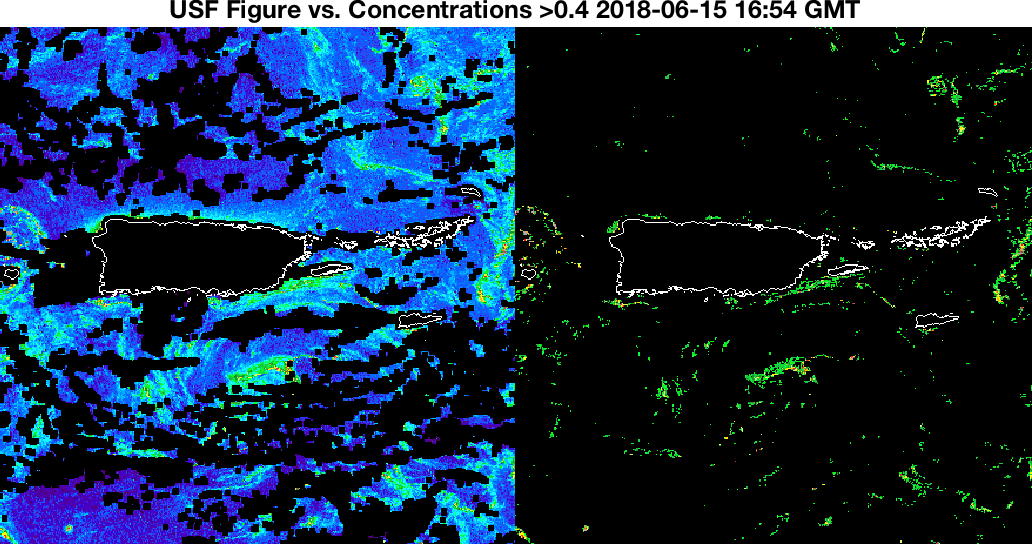
Figure 2B
Alternate Floating Algae Index map (left), map after first set of image processing to determine higher concentration areas of Sargassum (right)
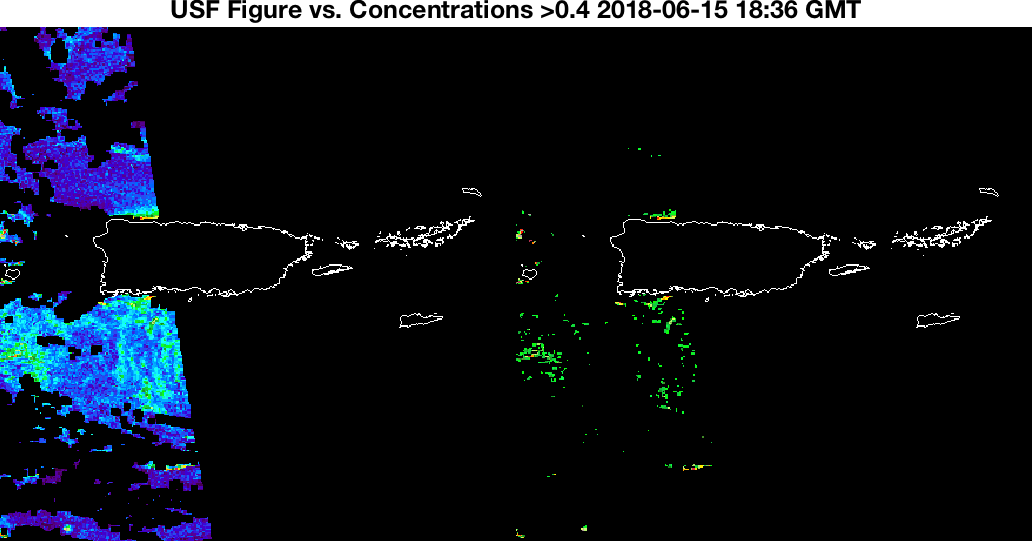
Figure 2C
Alternate Floating Algae Index map (left), map after first set of image processing to determine higher concentration areas of Sargassum (right). Original image is from (06/15/18 18:36) only two hours from Figure 2B, but shows dramatically different coverage due to satelite coverage.
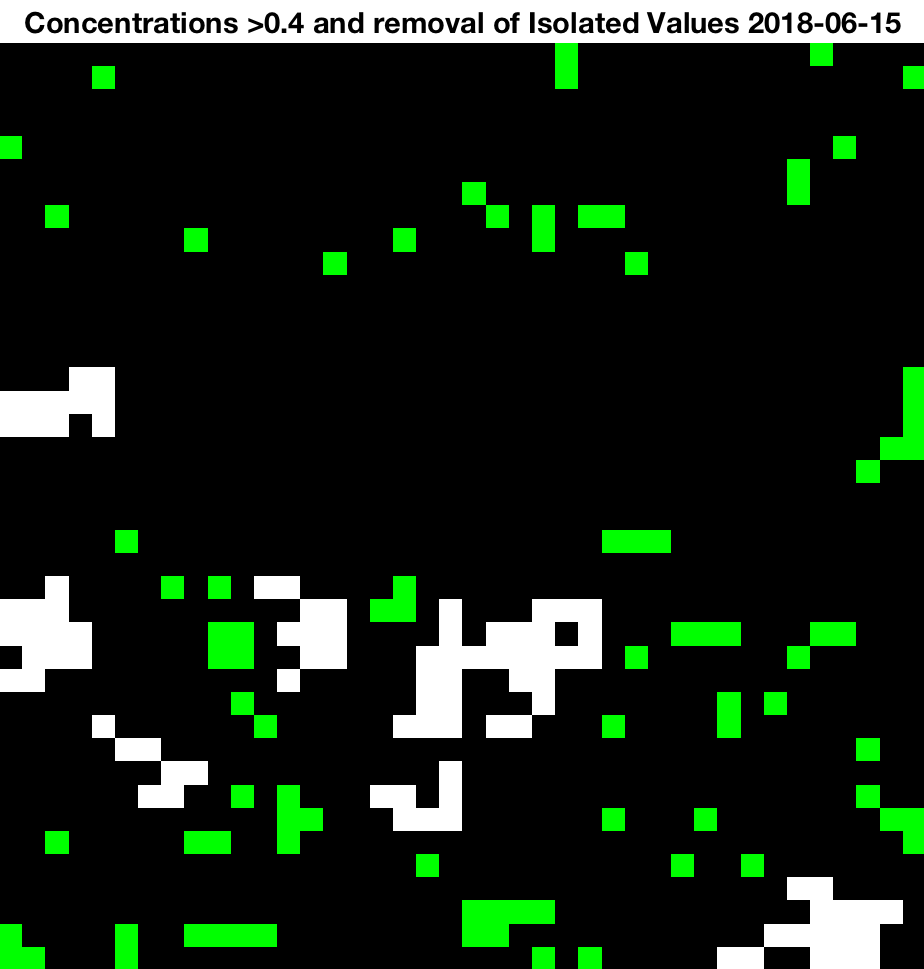
Figure 3A
Isolated values are removed for accuracy from Figure 2A
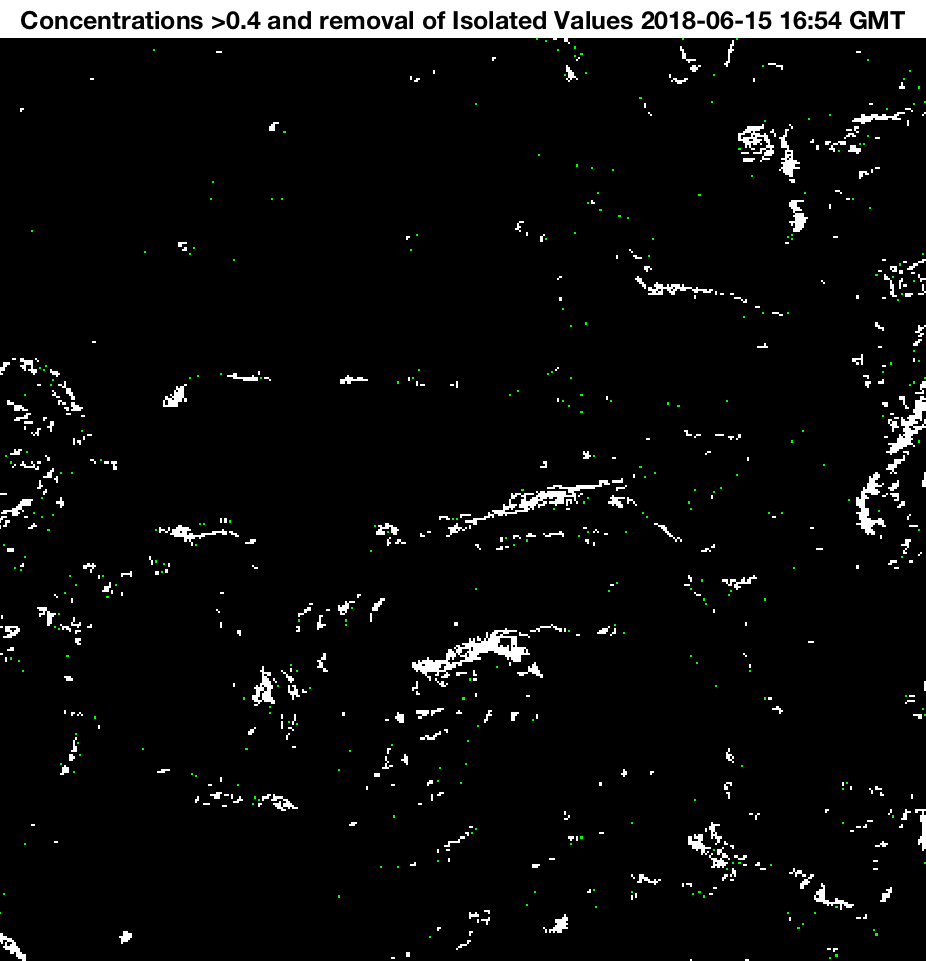
Figure 3B
Isolated values are removed for accuracy from Figure 2B
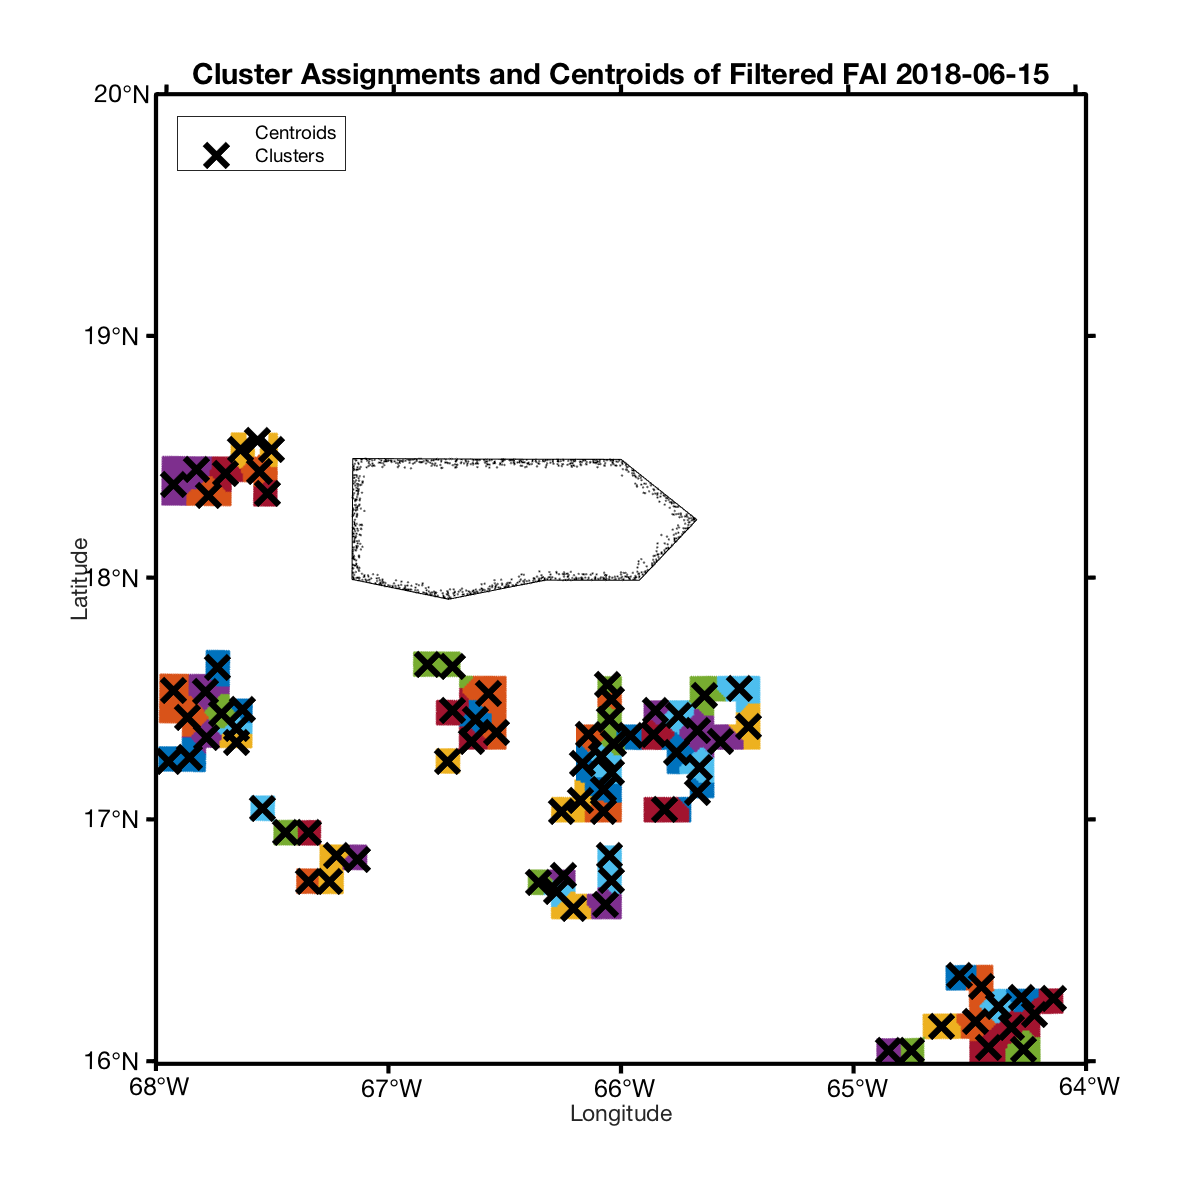
Figure 4A
High floating algae index concentrations clustered together by k-means for centroid locations to pinpoint particle movement. Product of original process (Figures 1A, 2A, and 3A)
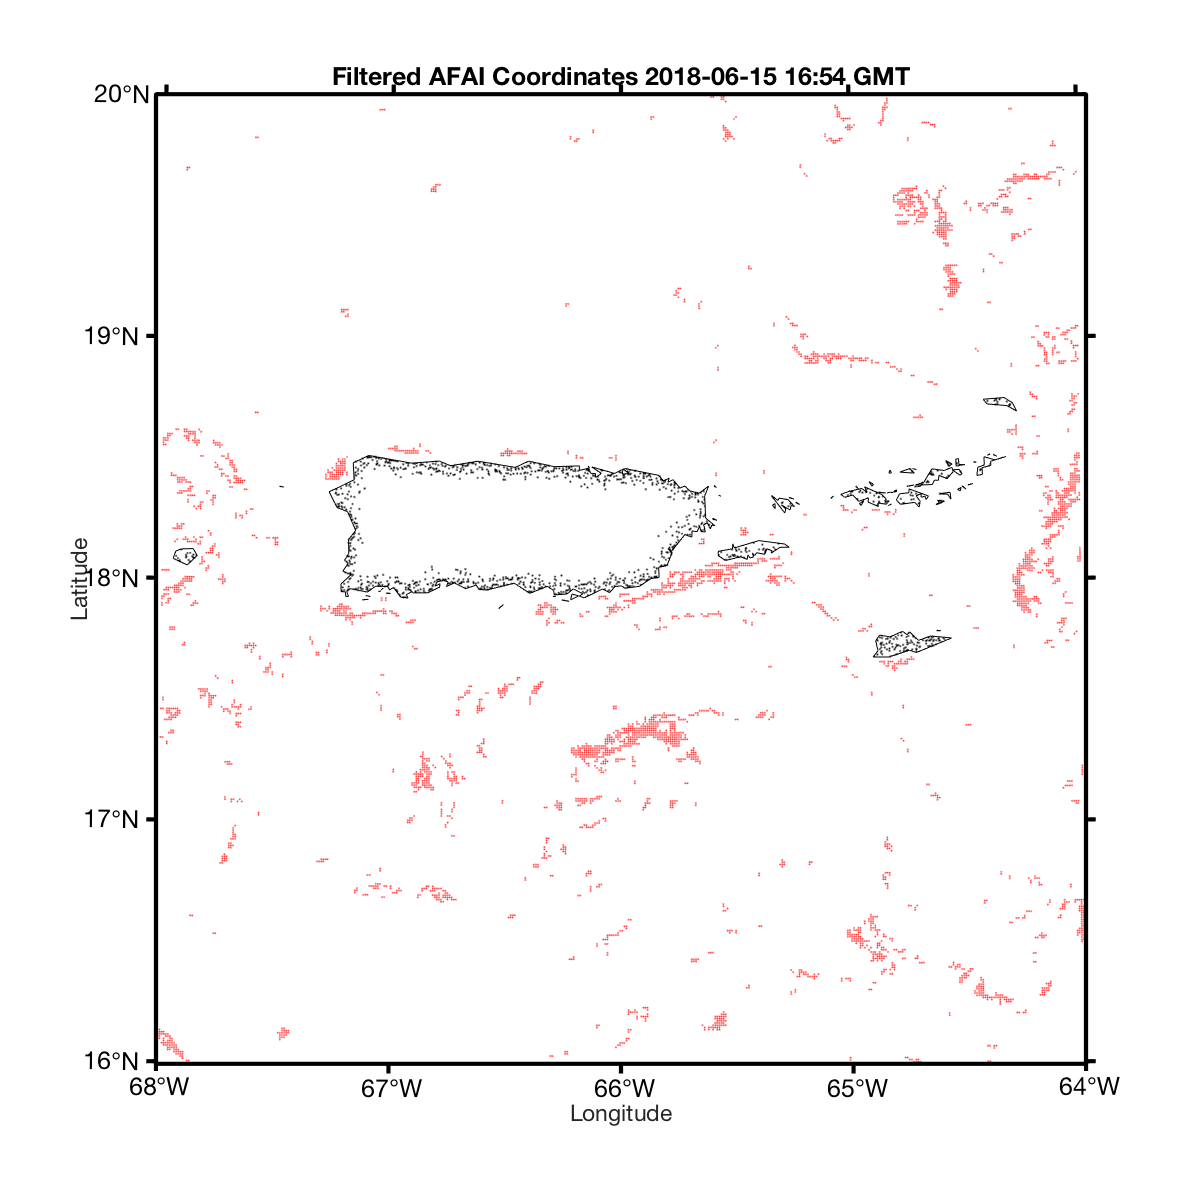
Figure 4B
High floating algae index concentration locations to be advected. Product of new, higher resolution process (Figures 1B, 2B, and 3B)
Figure 5A
Virtual drifters animation over a 24 hour period starting on 06/15/18 00:00 GMT. This is a product of analyzing the FAI Density Maps (Figures 1A, 2A, 3A, and 4A) provided by the University of Southern Florida’s Optical Oceanography Laboratory and advecting using the AmSeas ocean model..
Figure 5B
High resolution drifters animation over a 48 hour period starting on 06/15/18 16:54 GMT. This is a product of analyzing the AFAI Maps (Figures 1B, 2B, 3B, and 4B) provided by the University of Southern Florida’s Optical Oceanography Laboratory and advecting using the AmSeas ocean model..