-
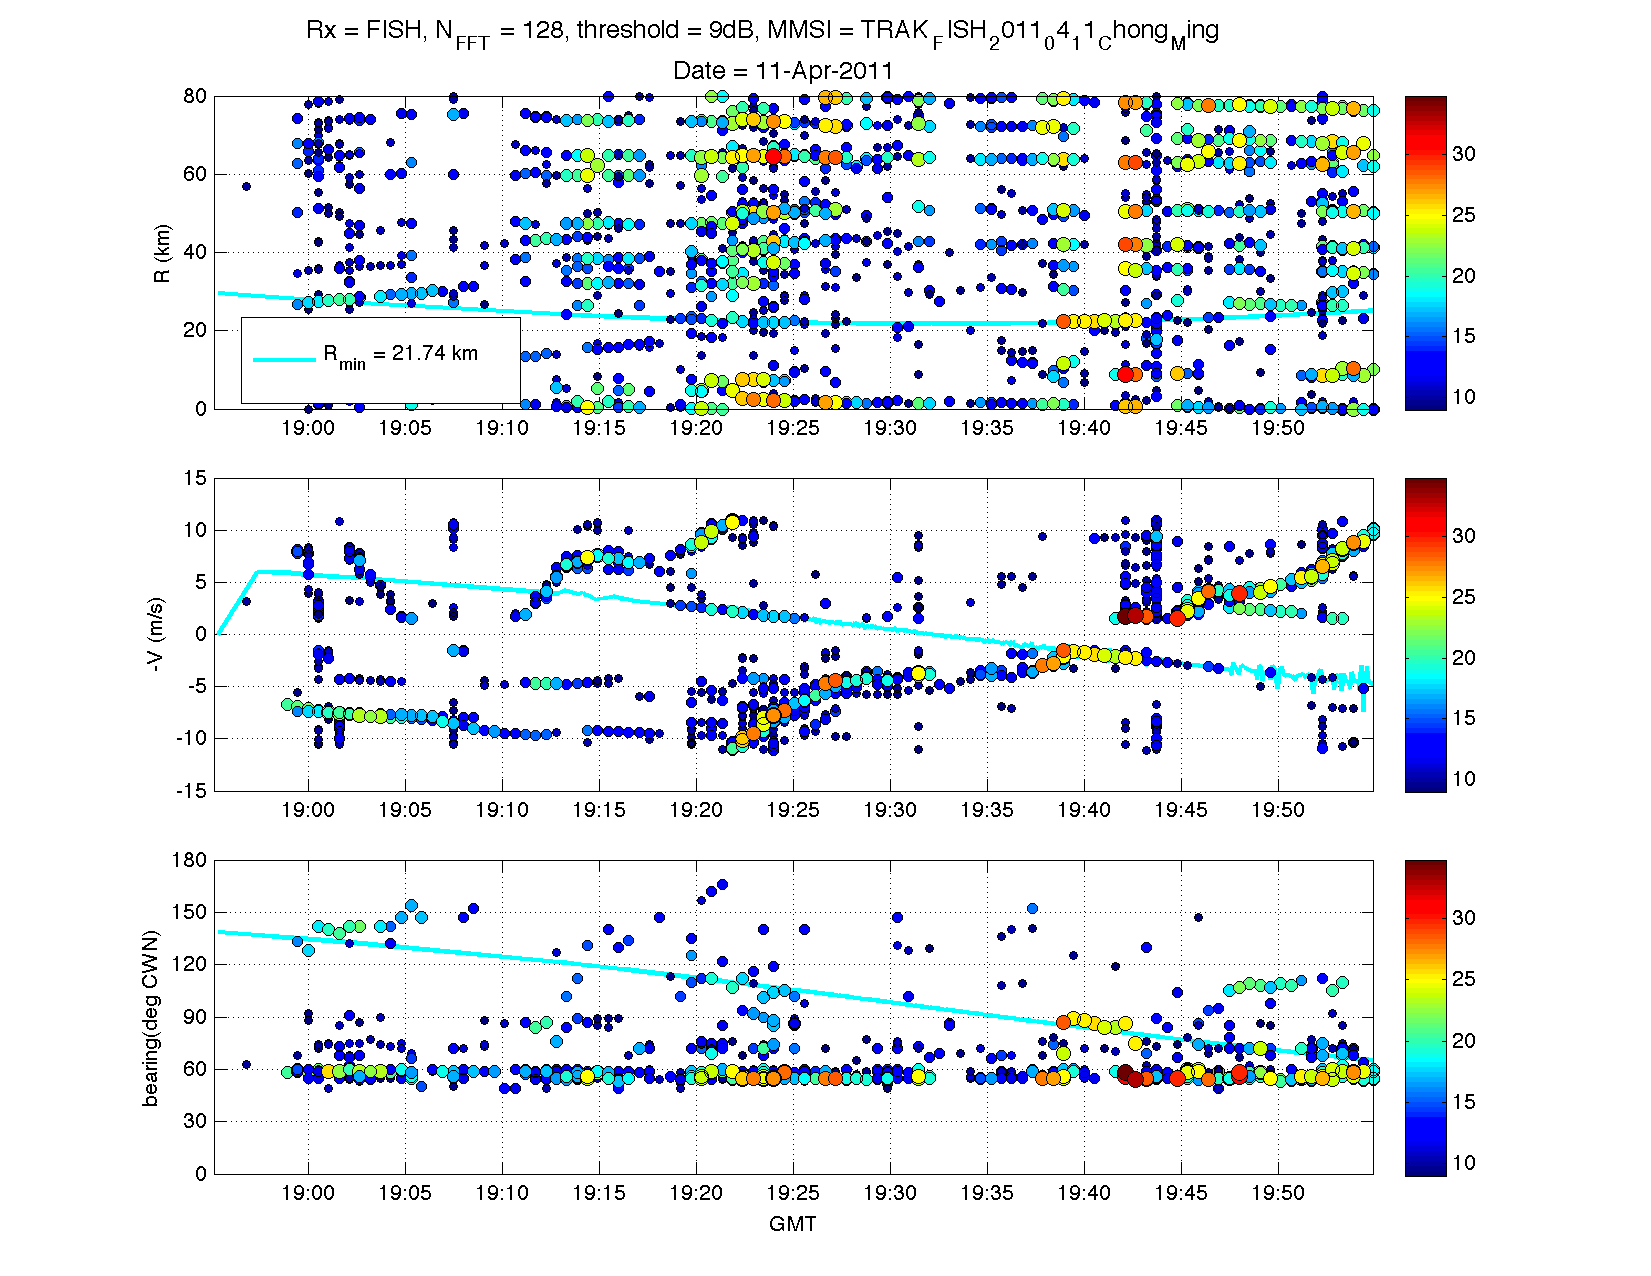
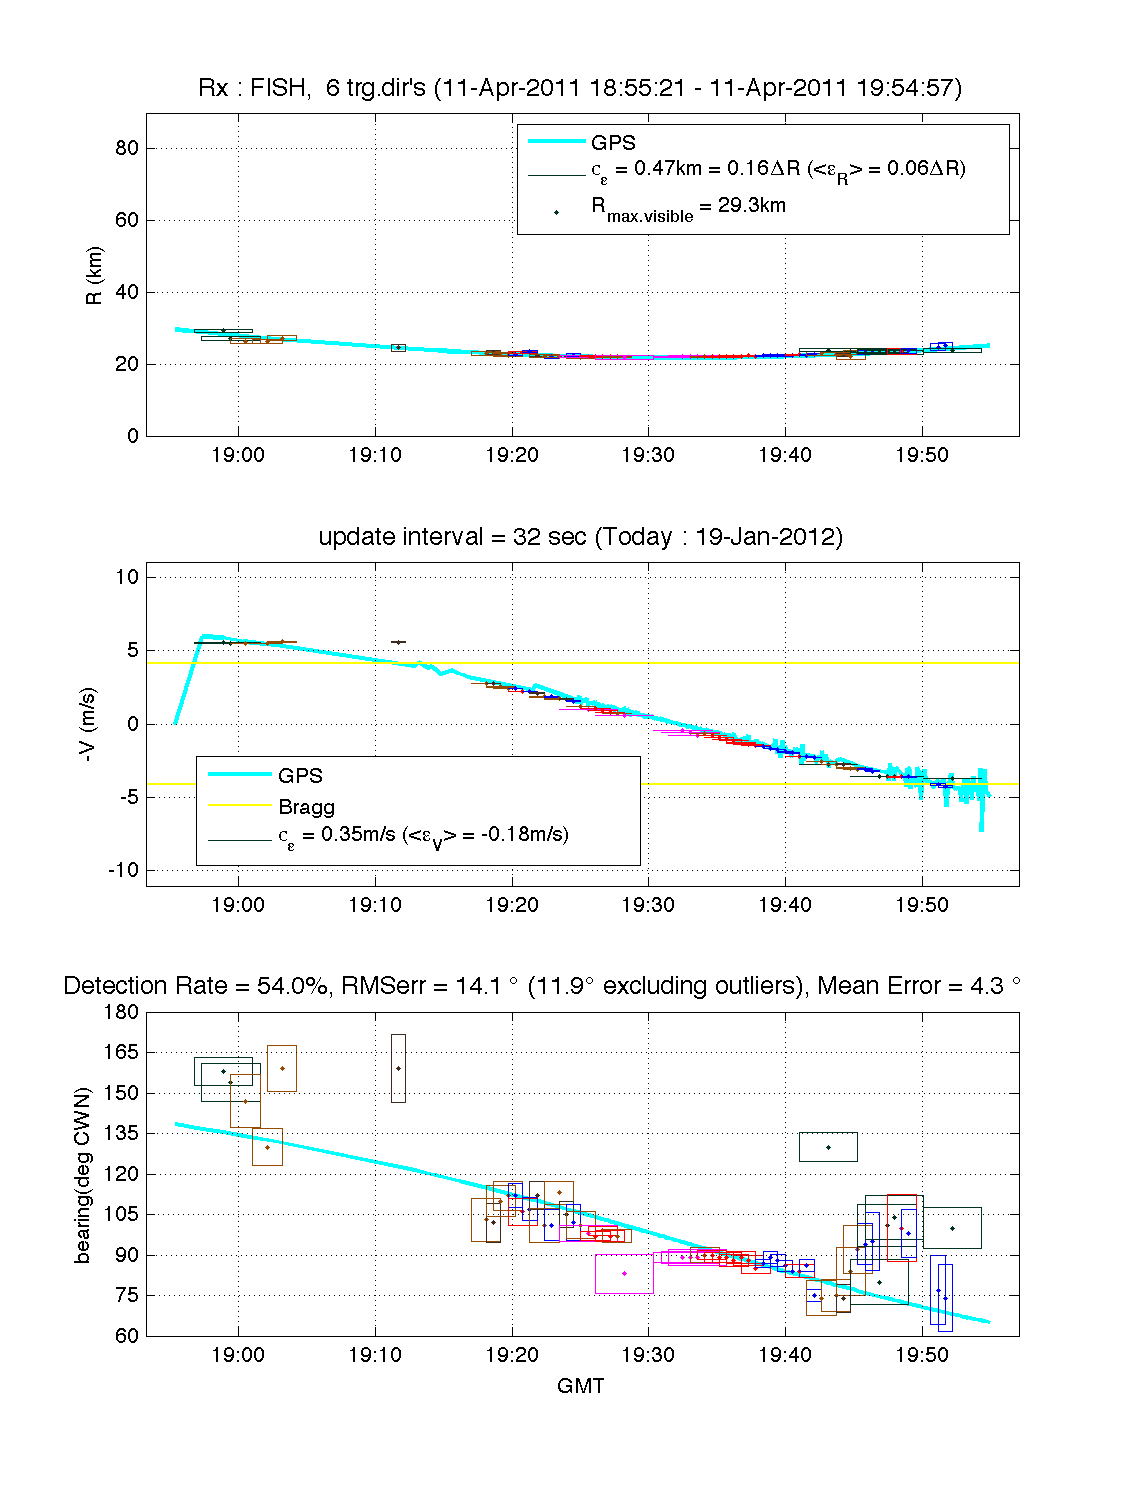
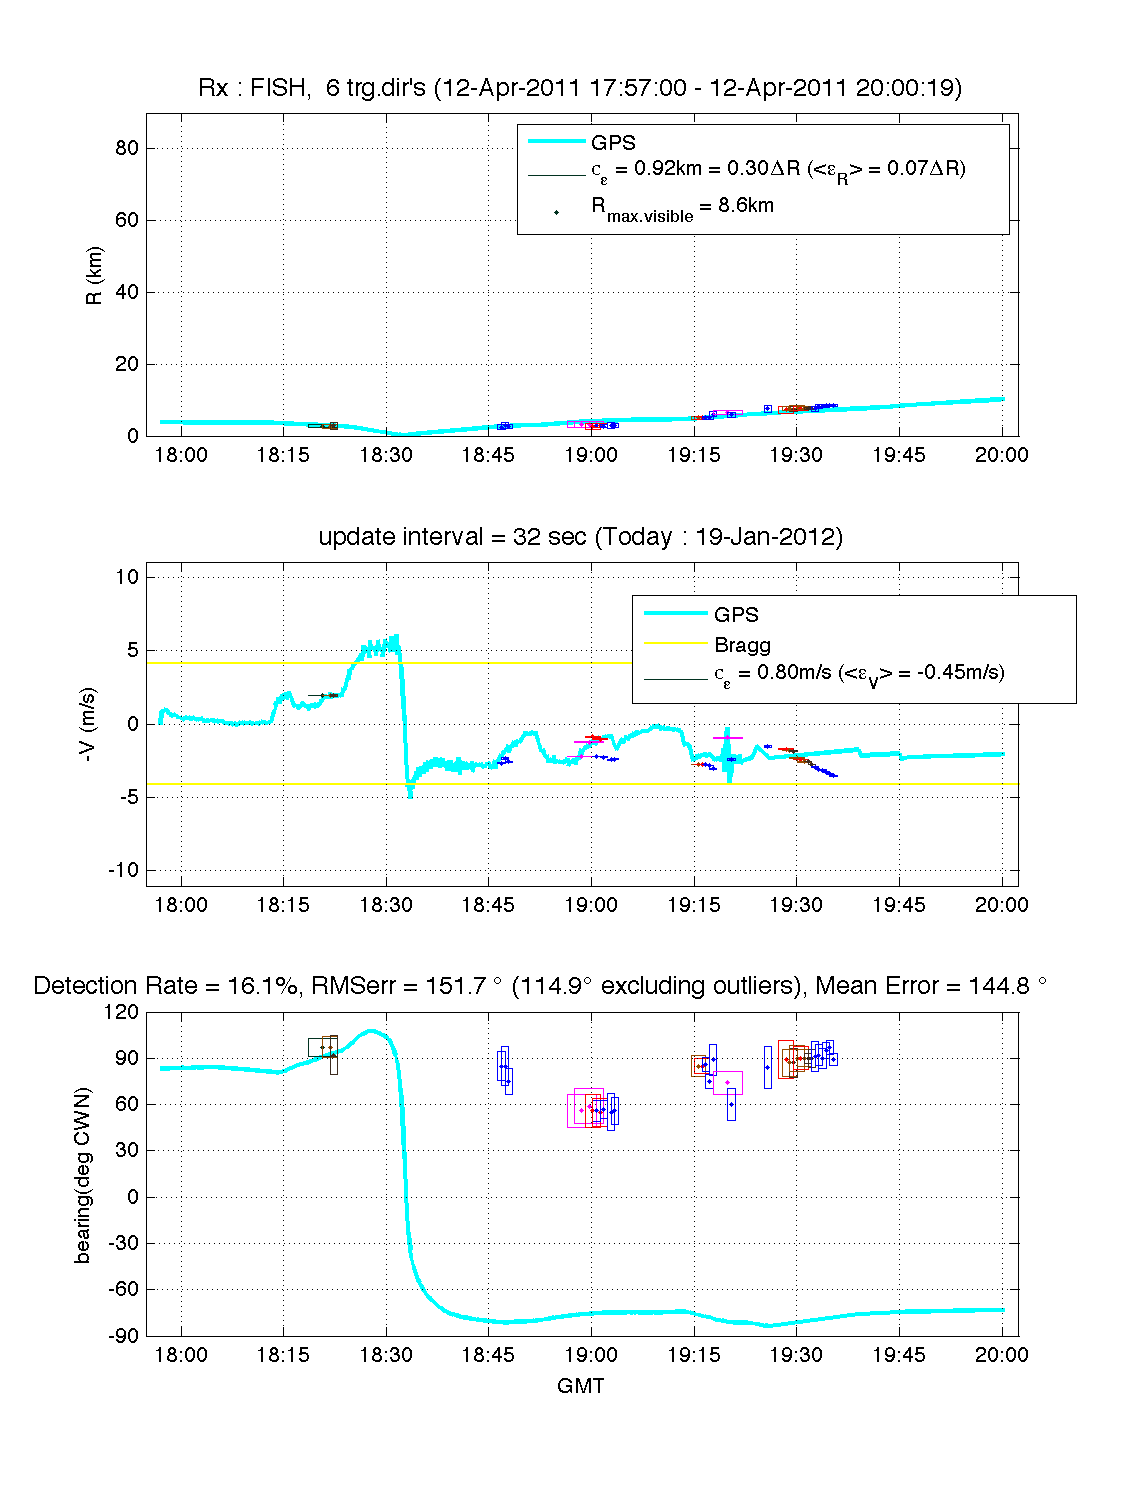
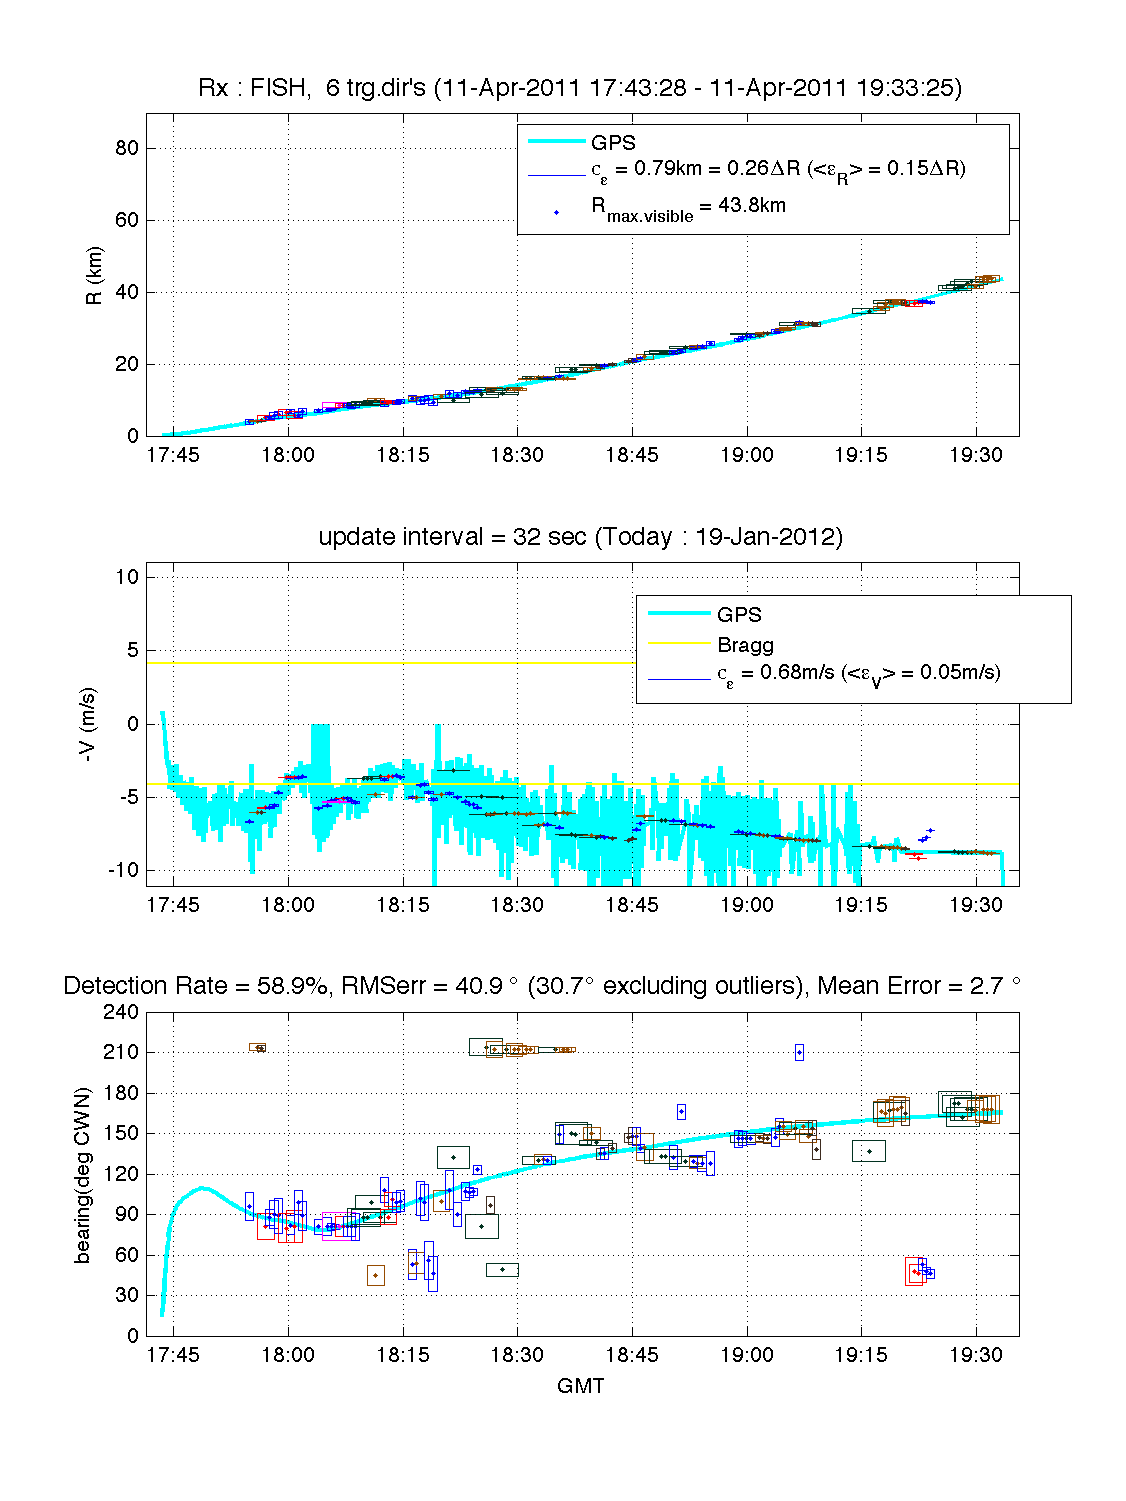
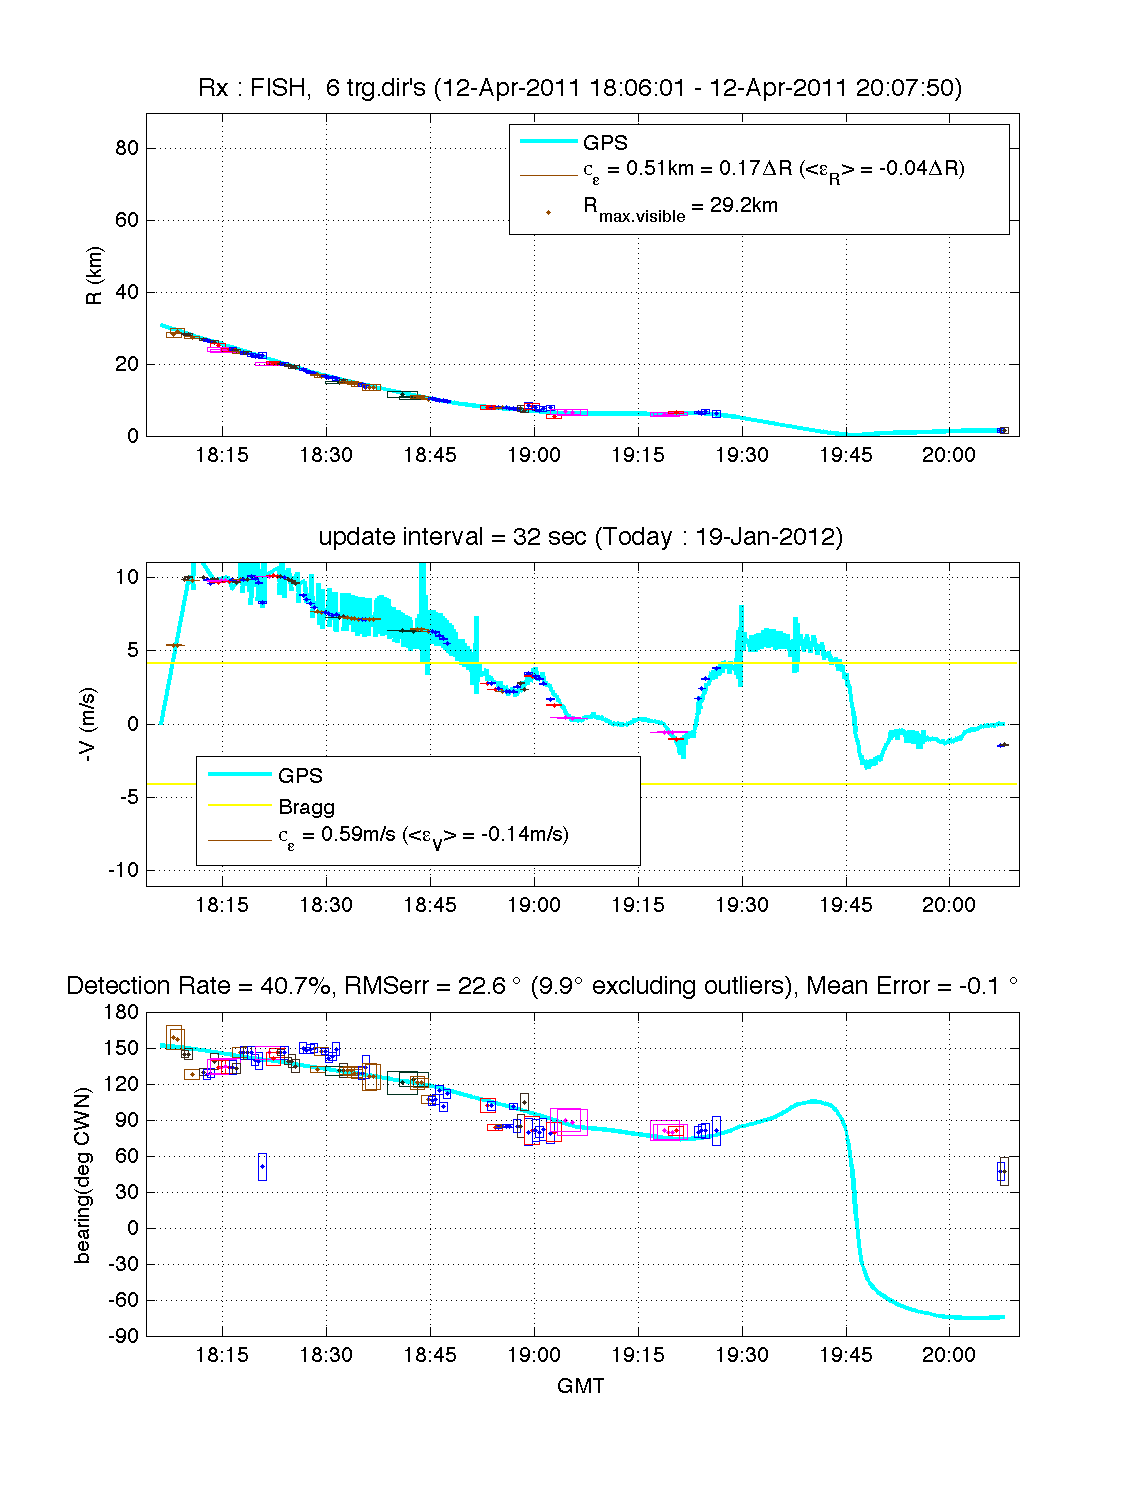
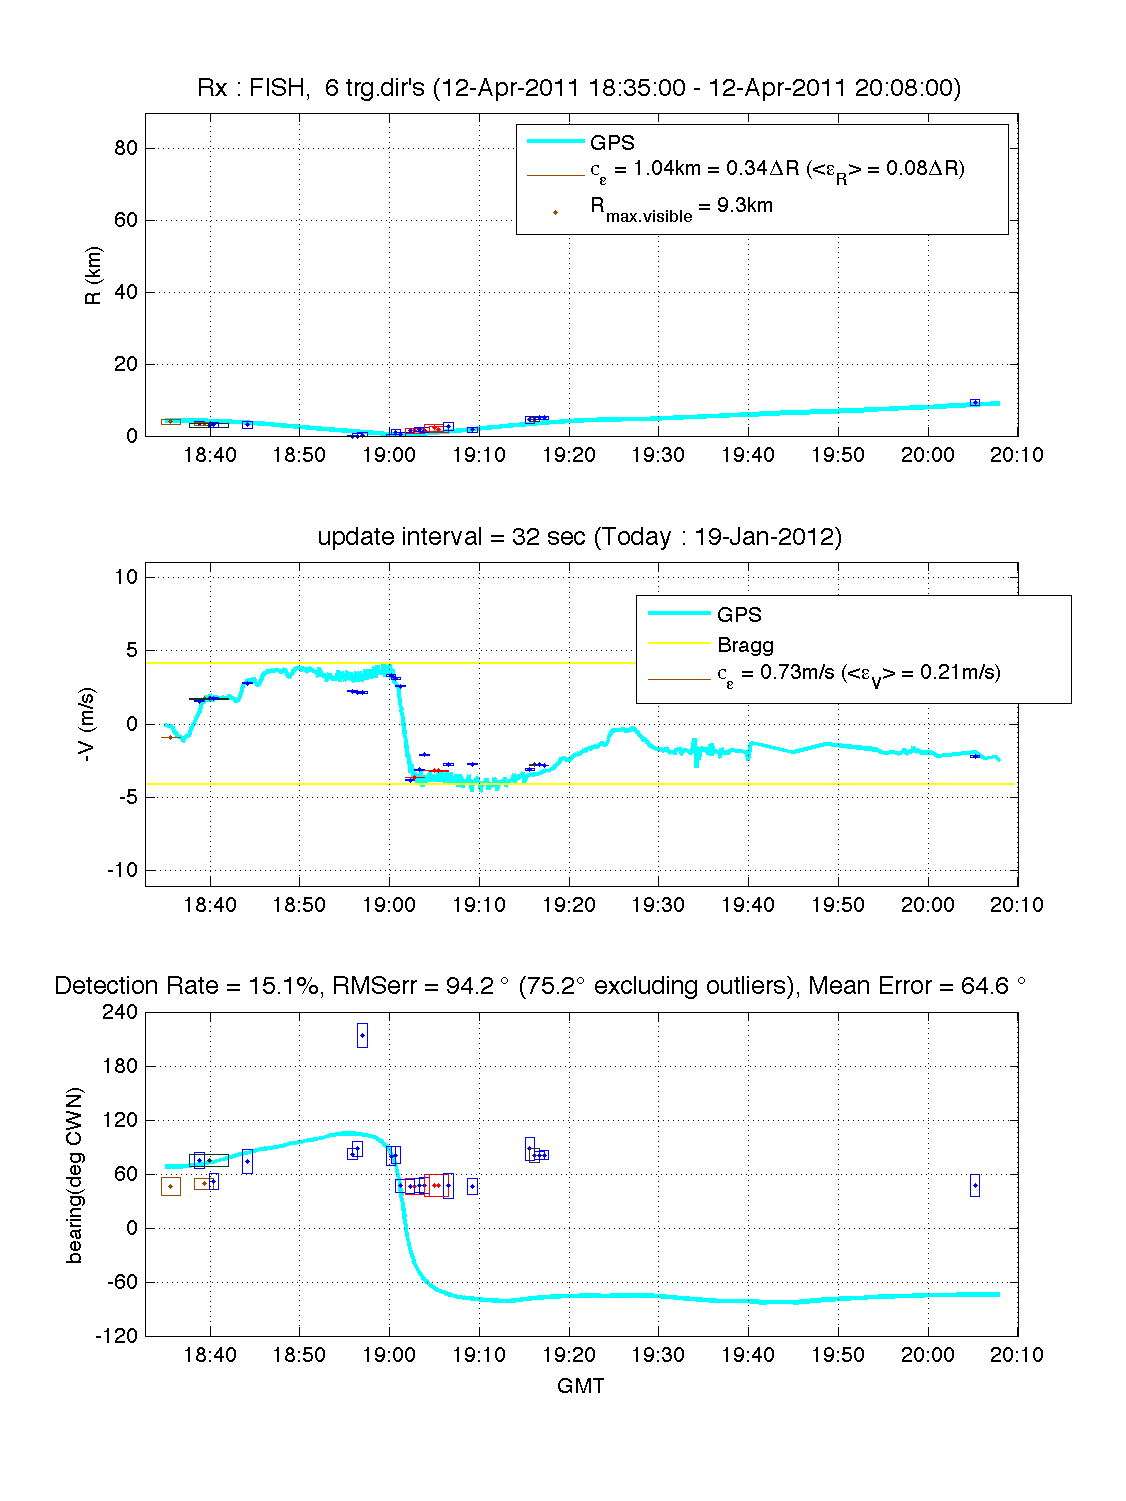
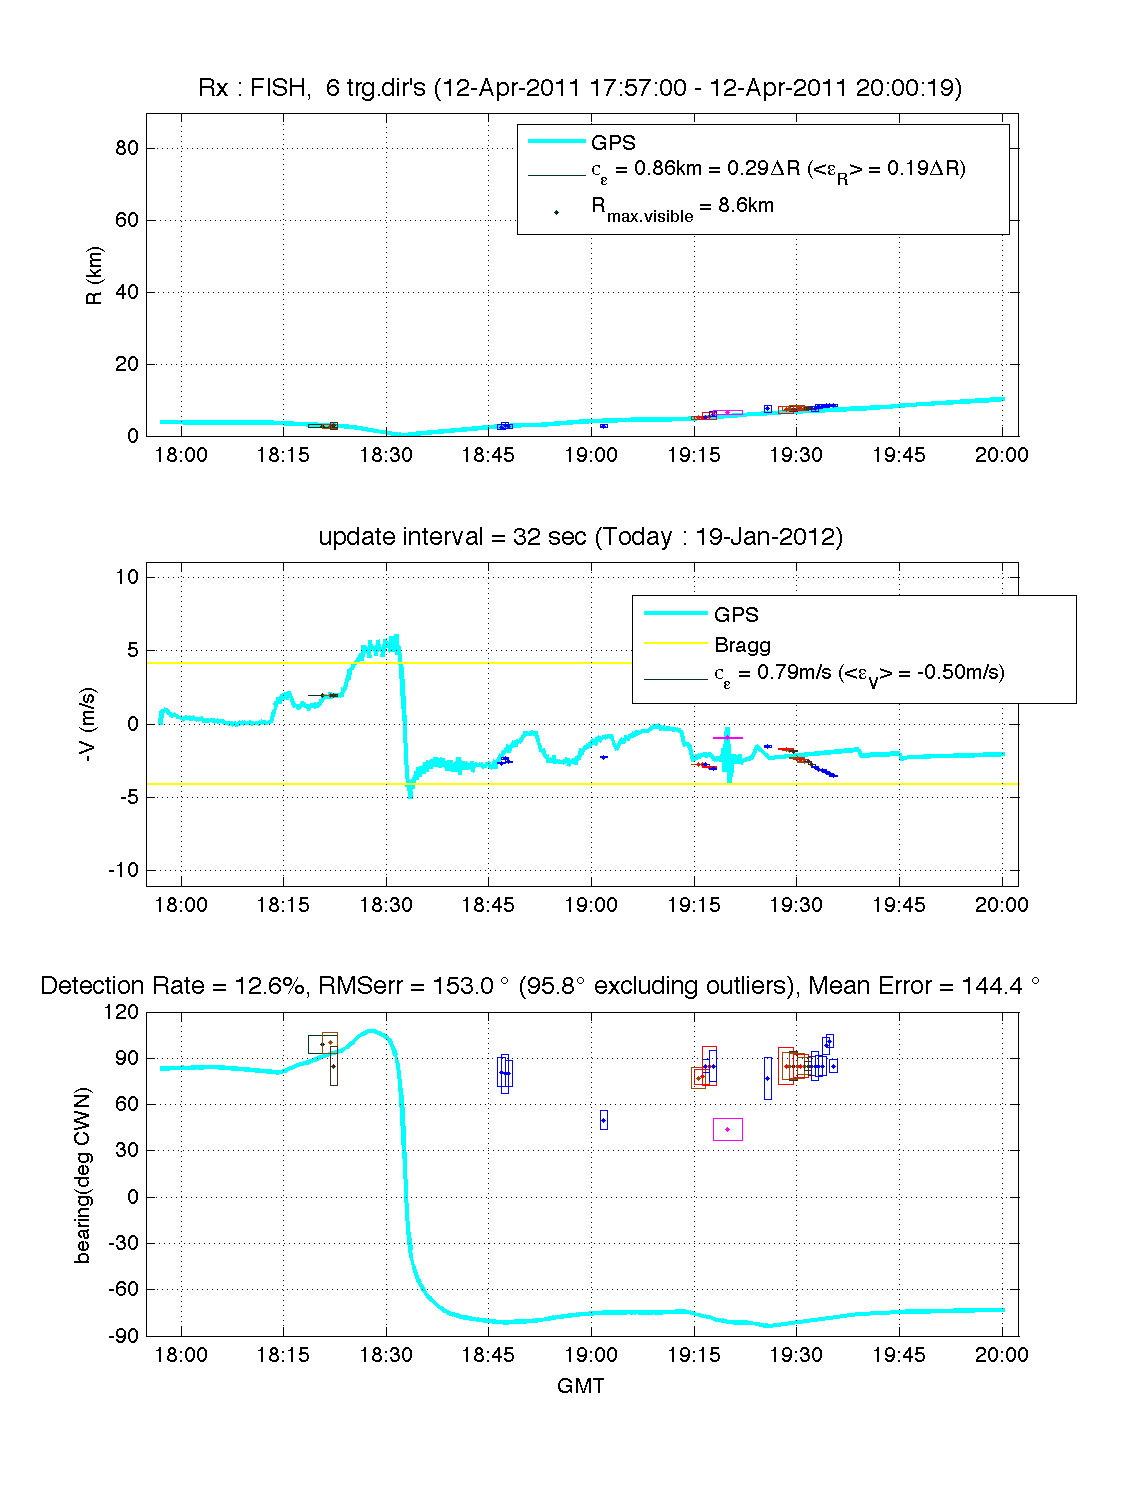
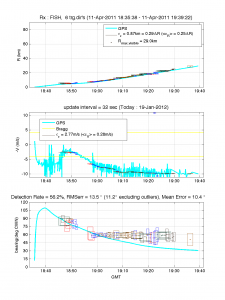
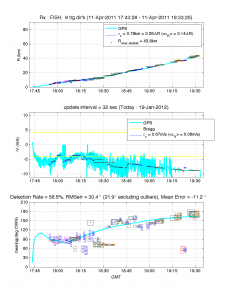
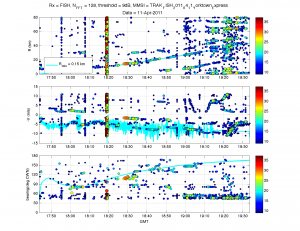
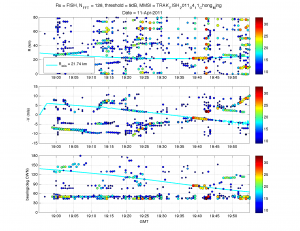
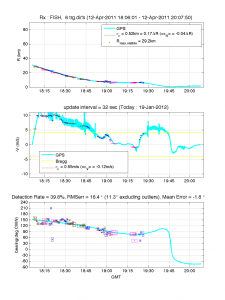
Fisher Island Experiment – 20 degrees smoothing
Posted on January 19th, 2012 No commentsChong Ming
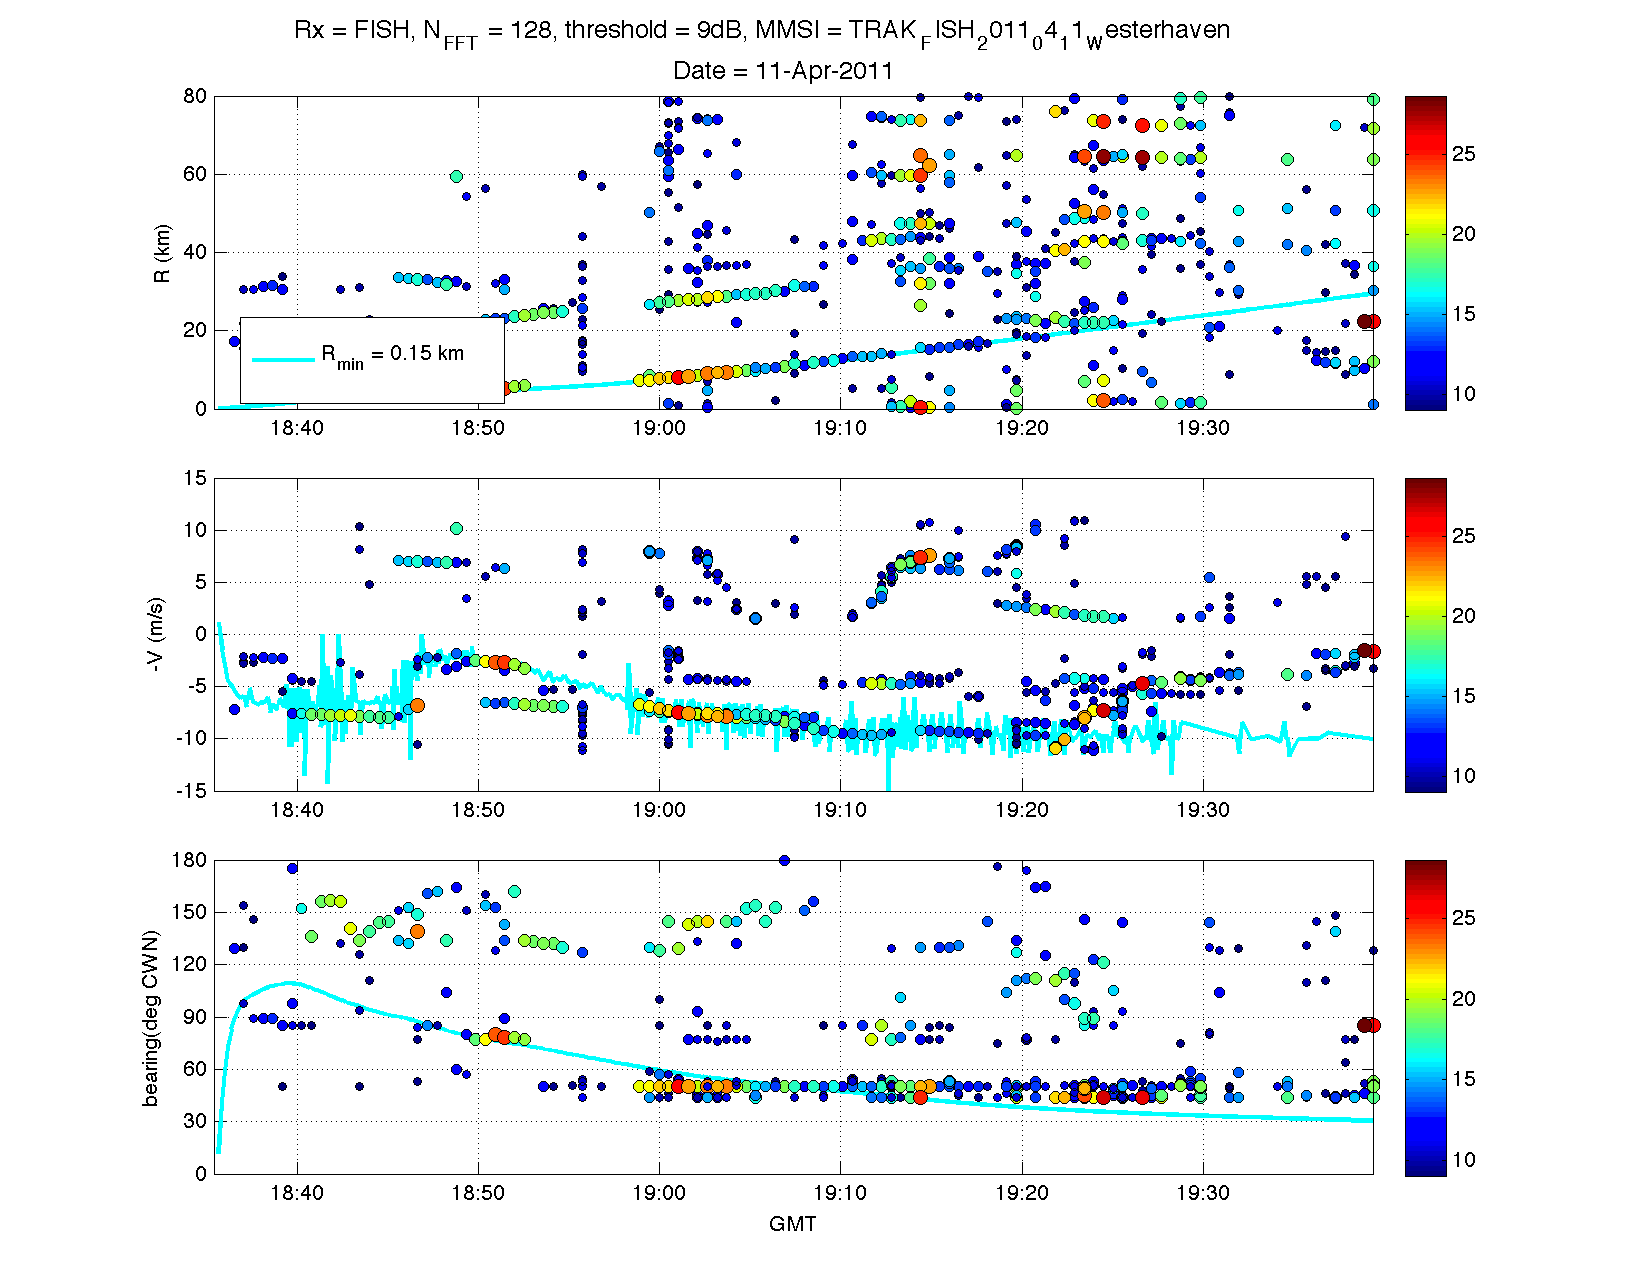
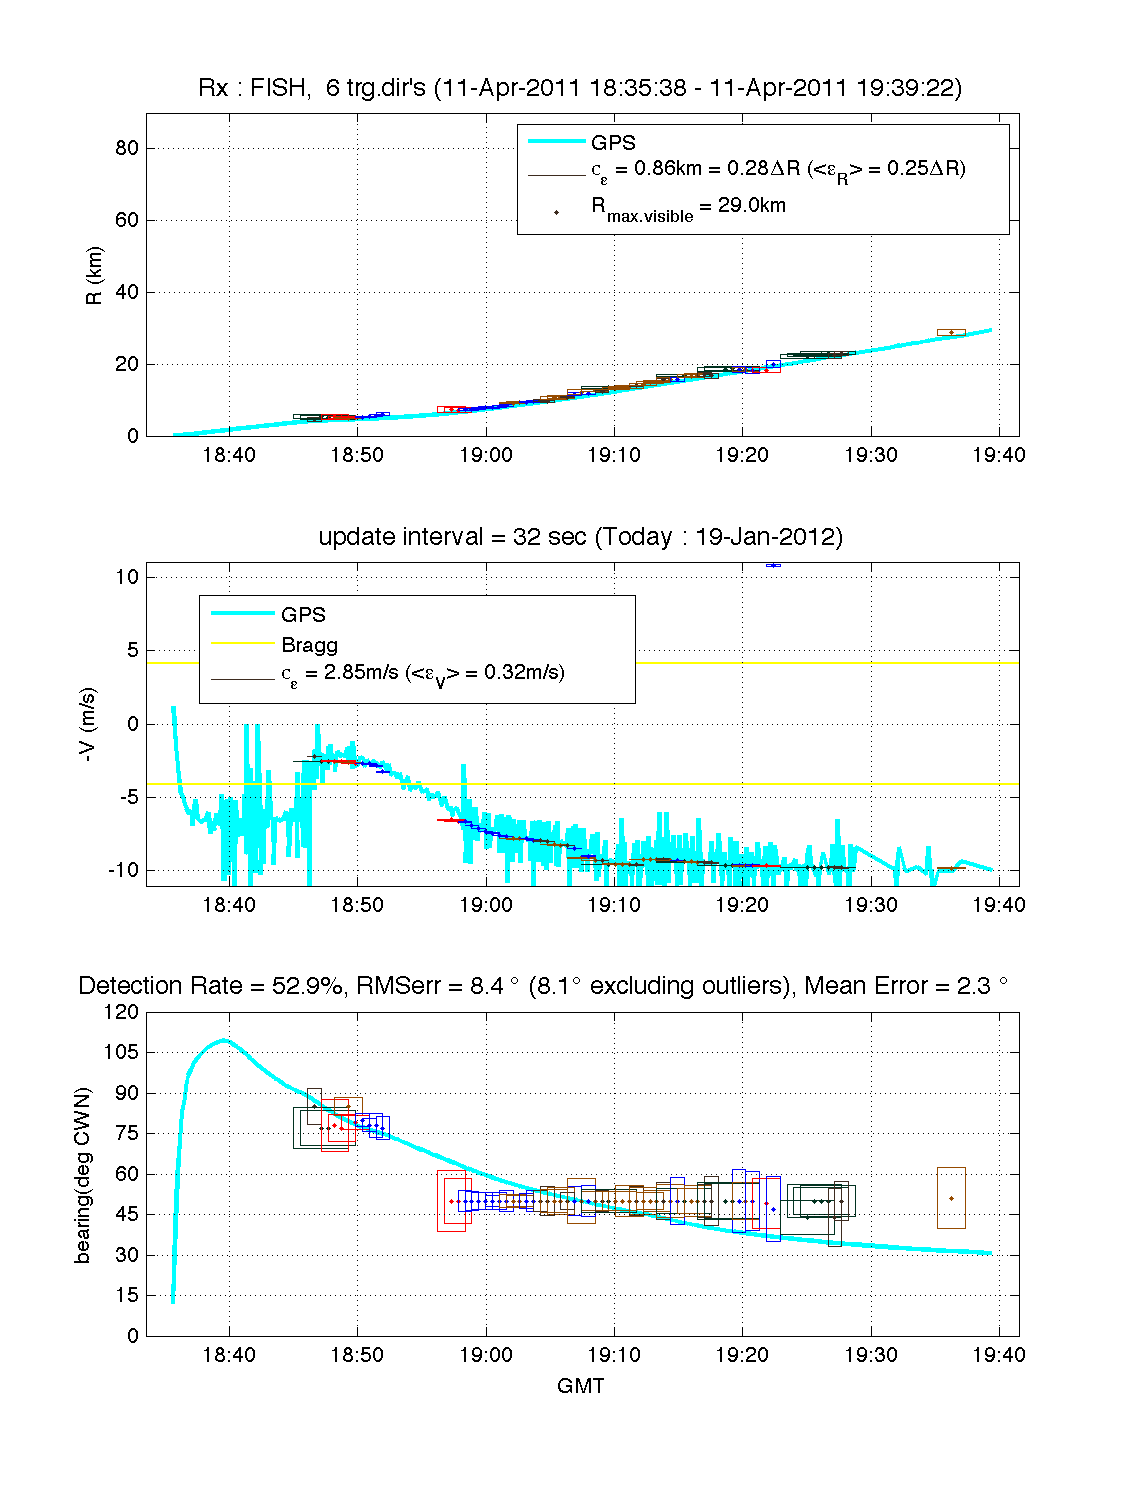
 Westerhaven
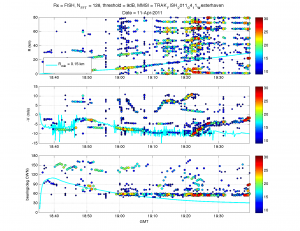
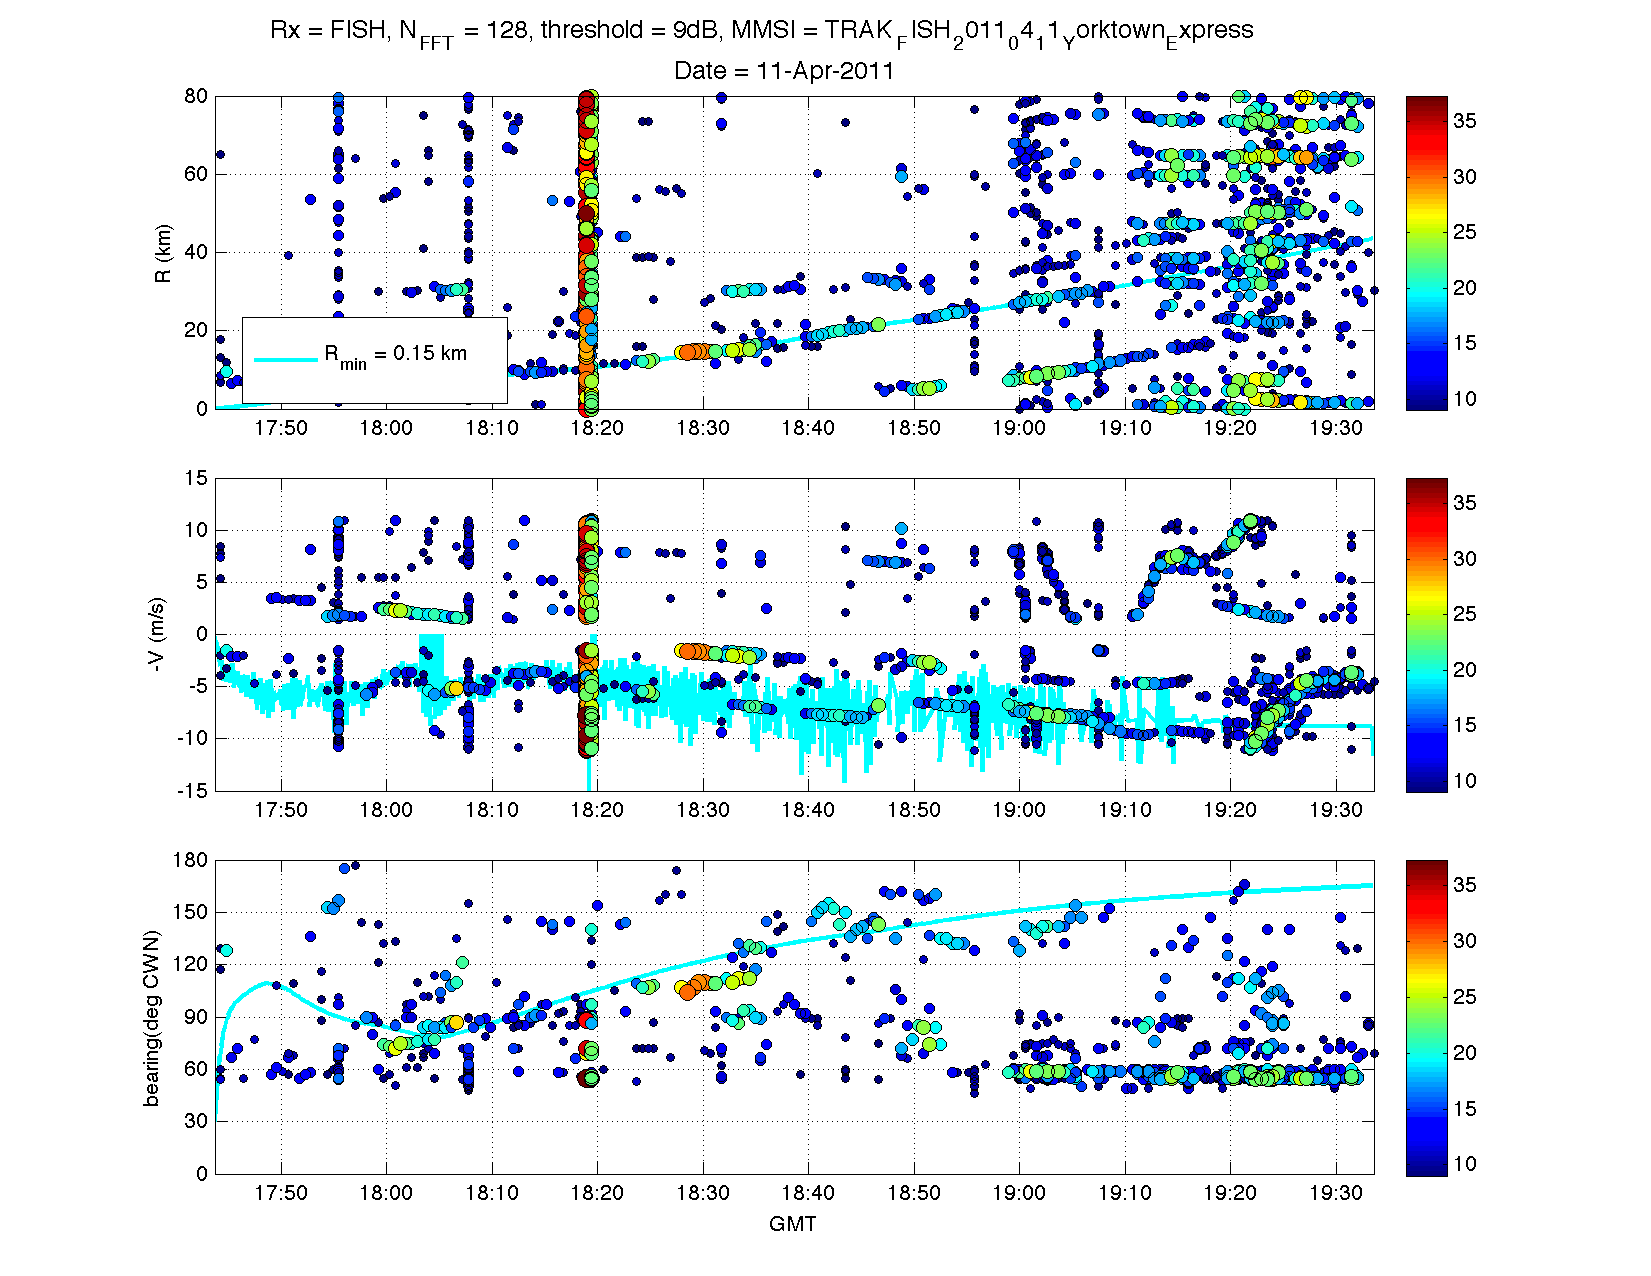
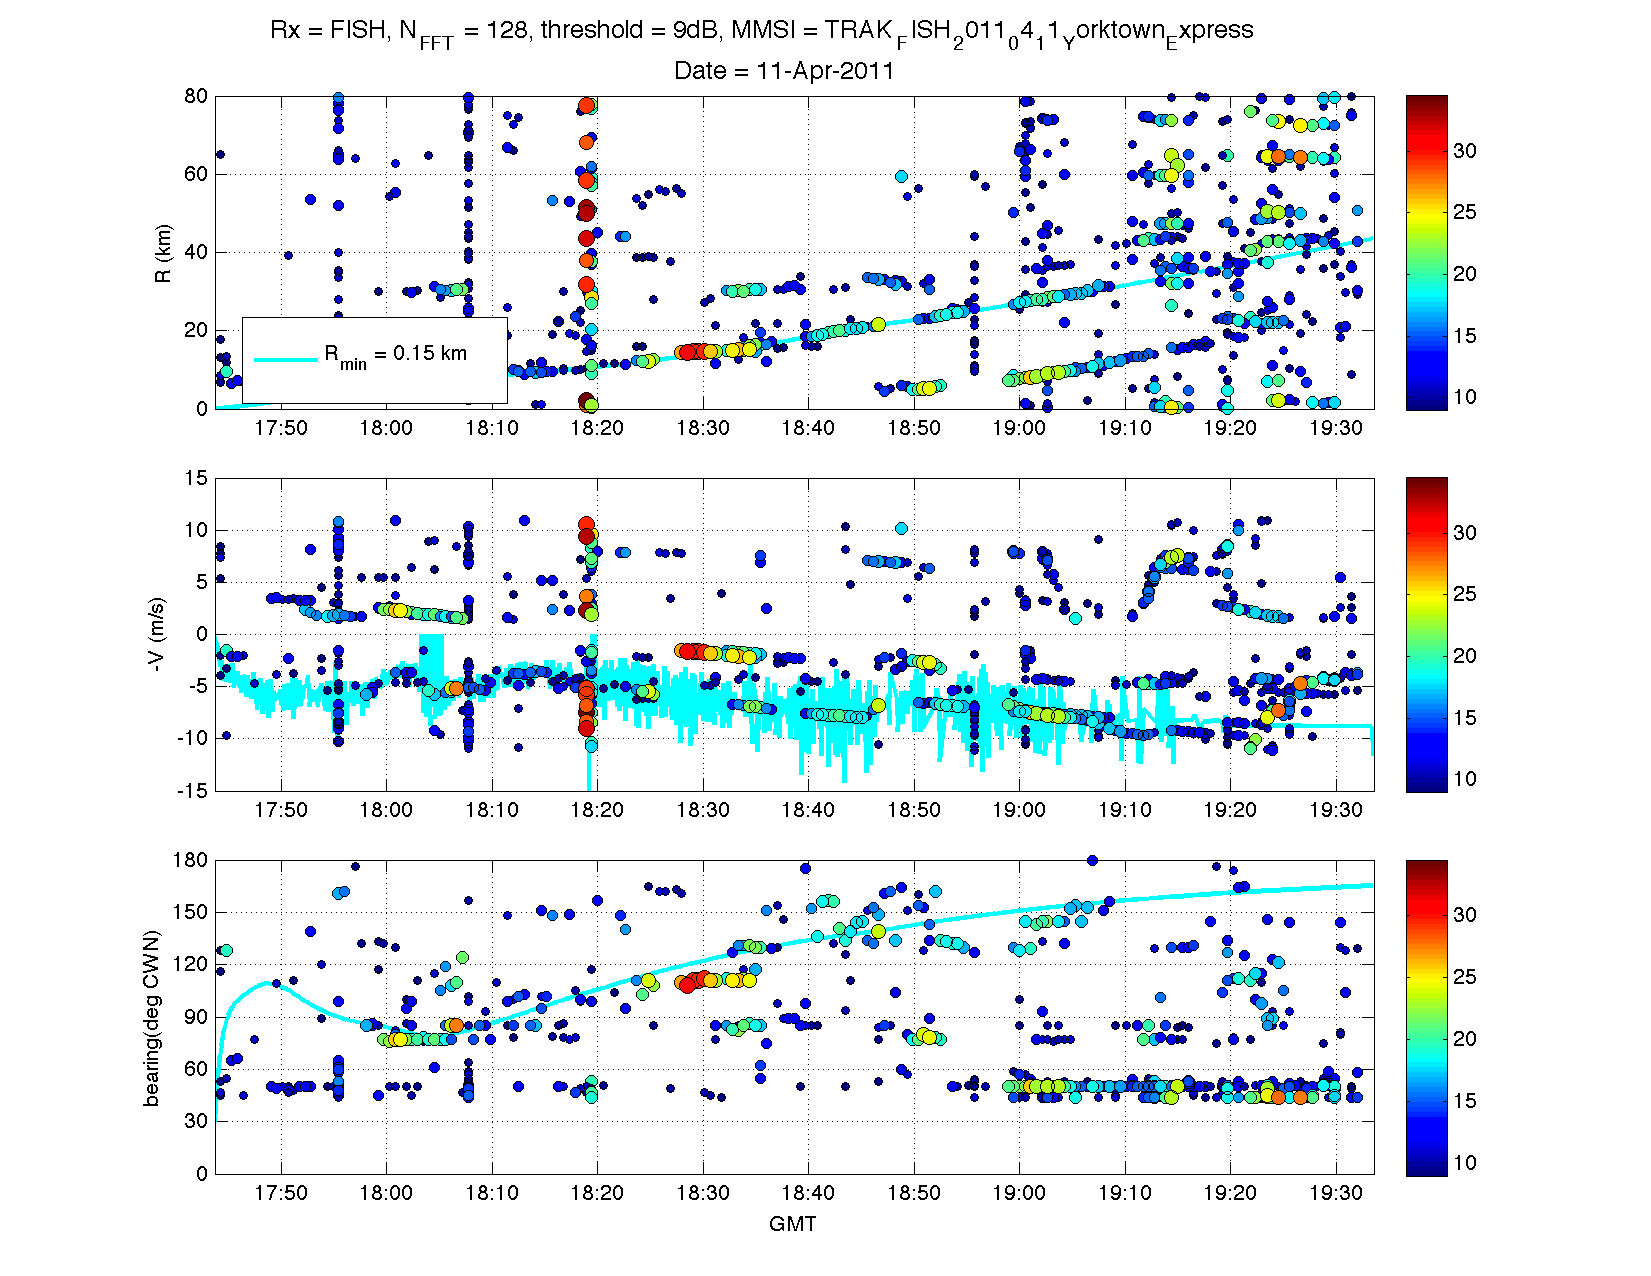
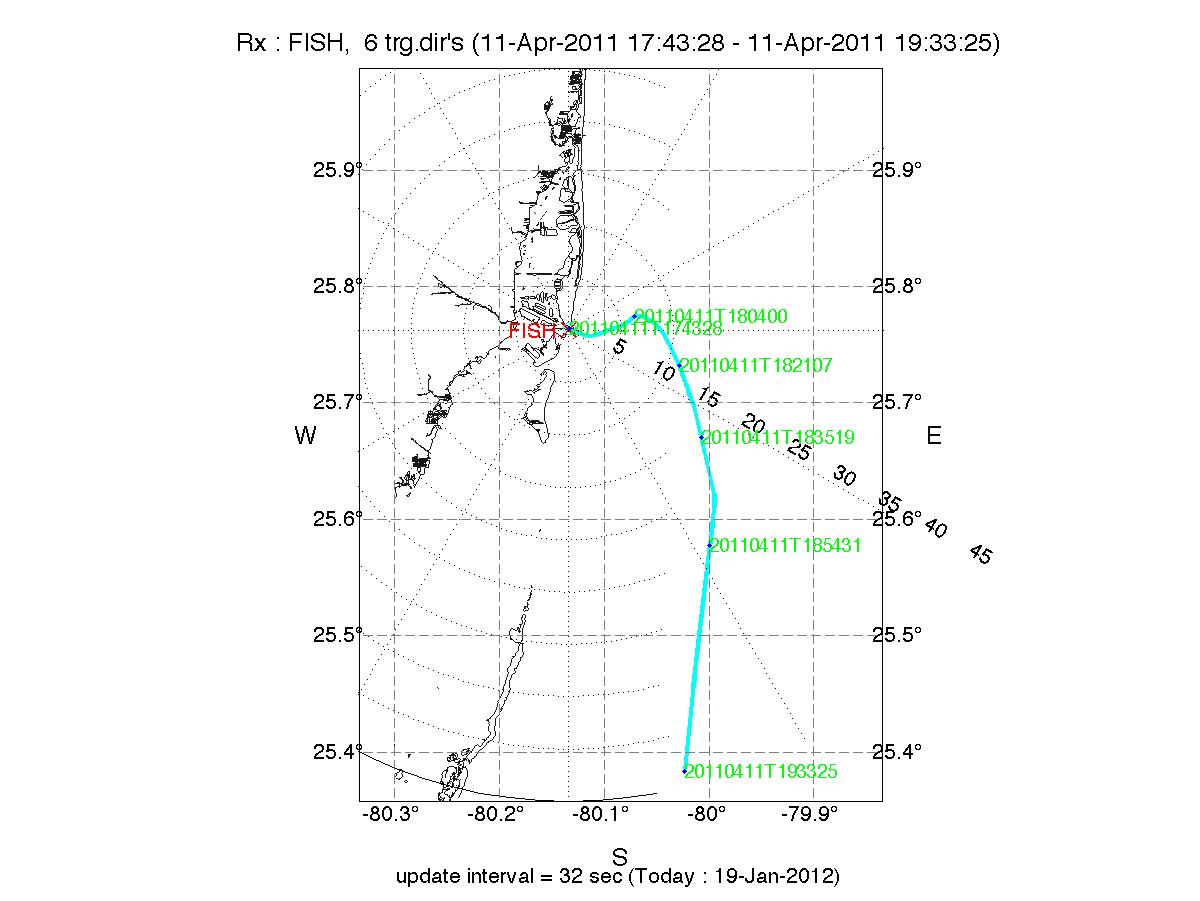
 Yorktown Express
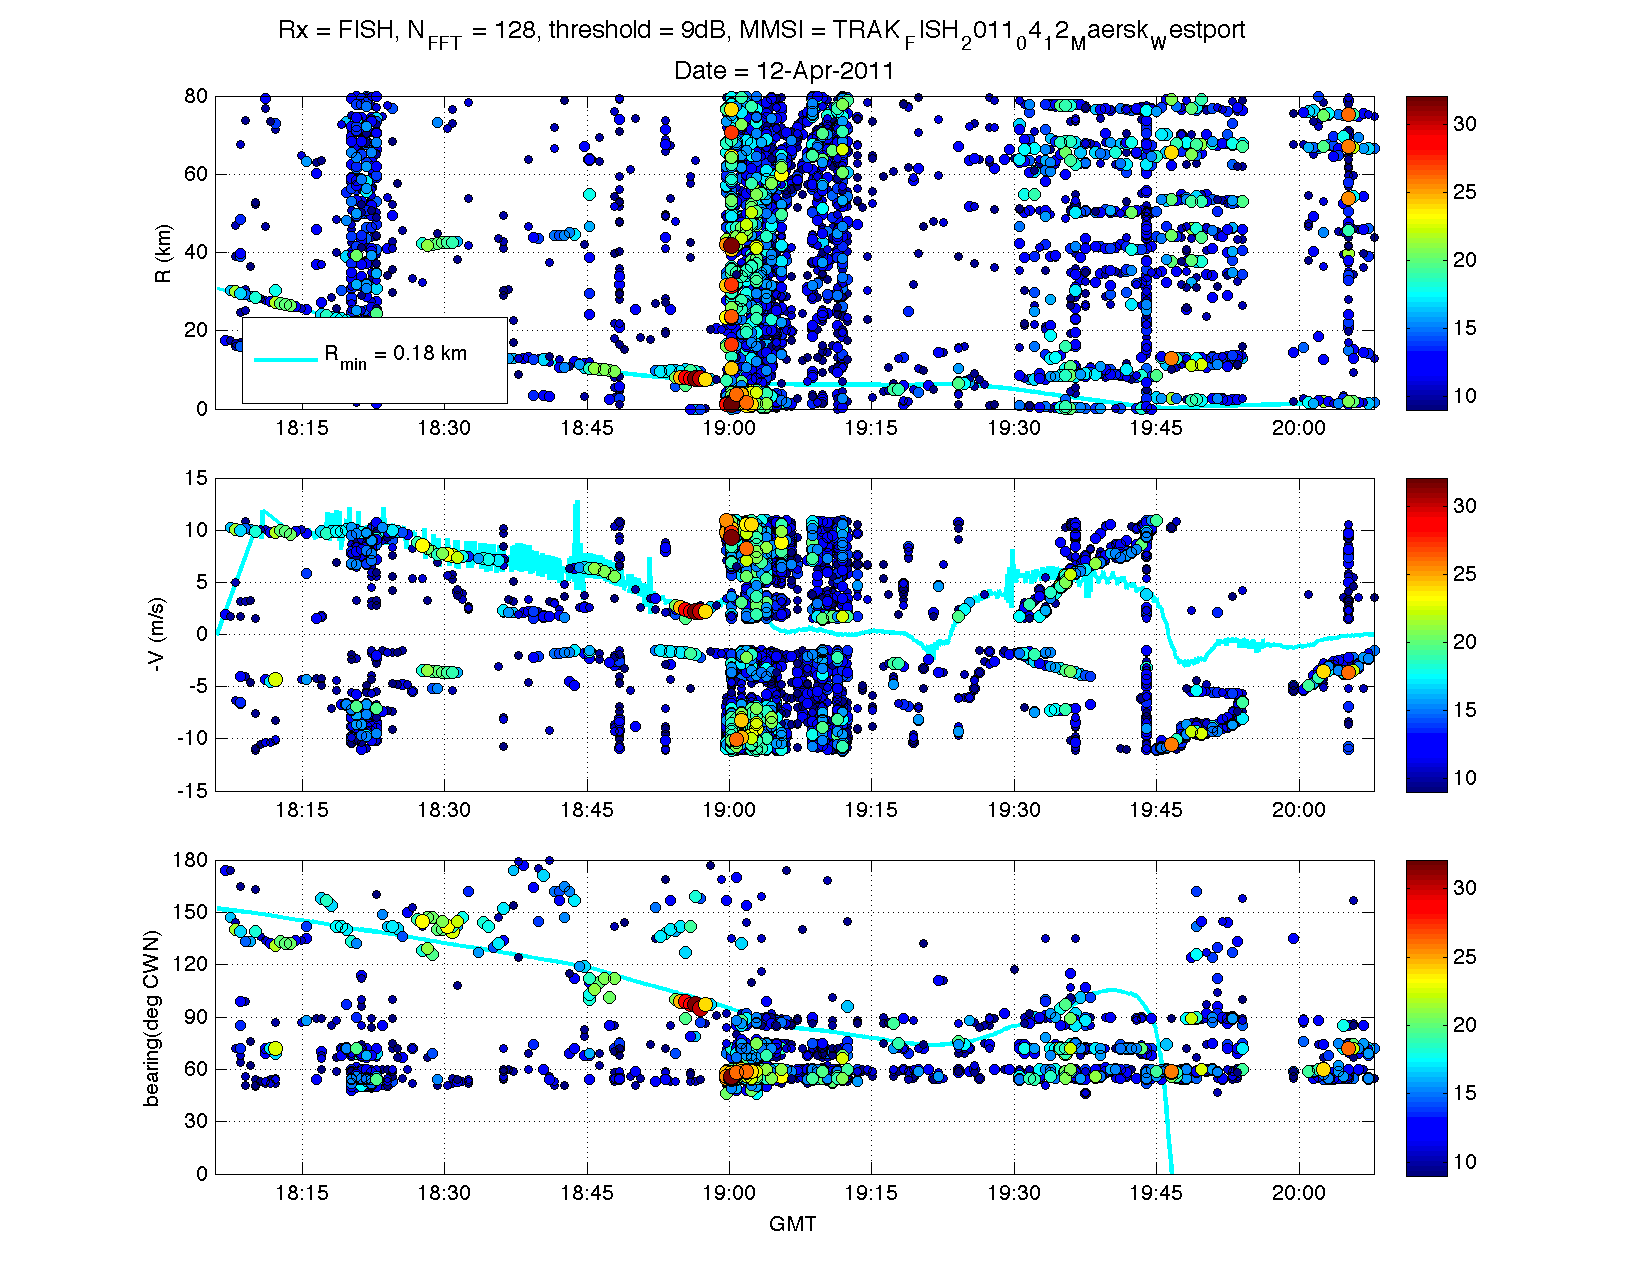
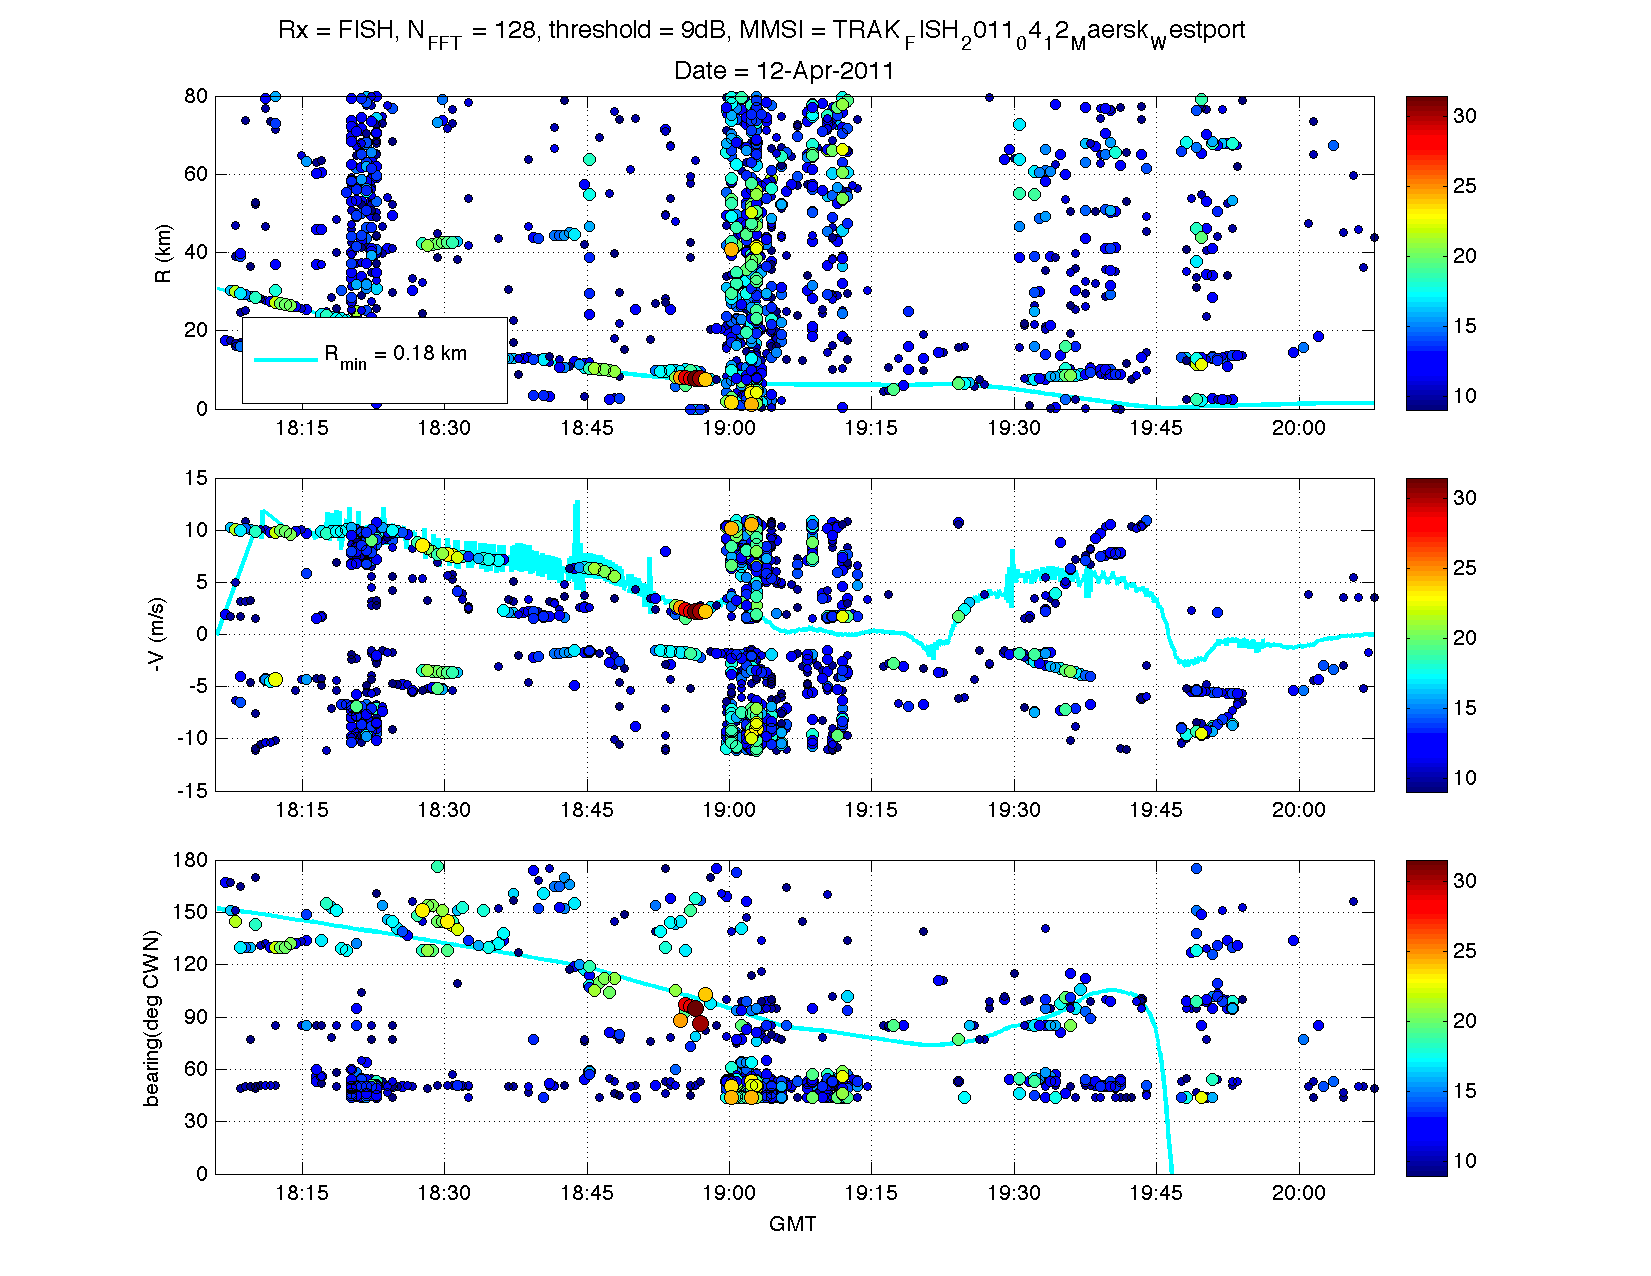
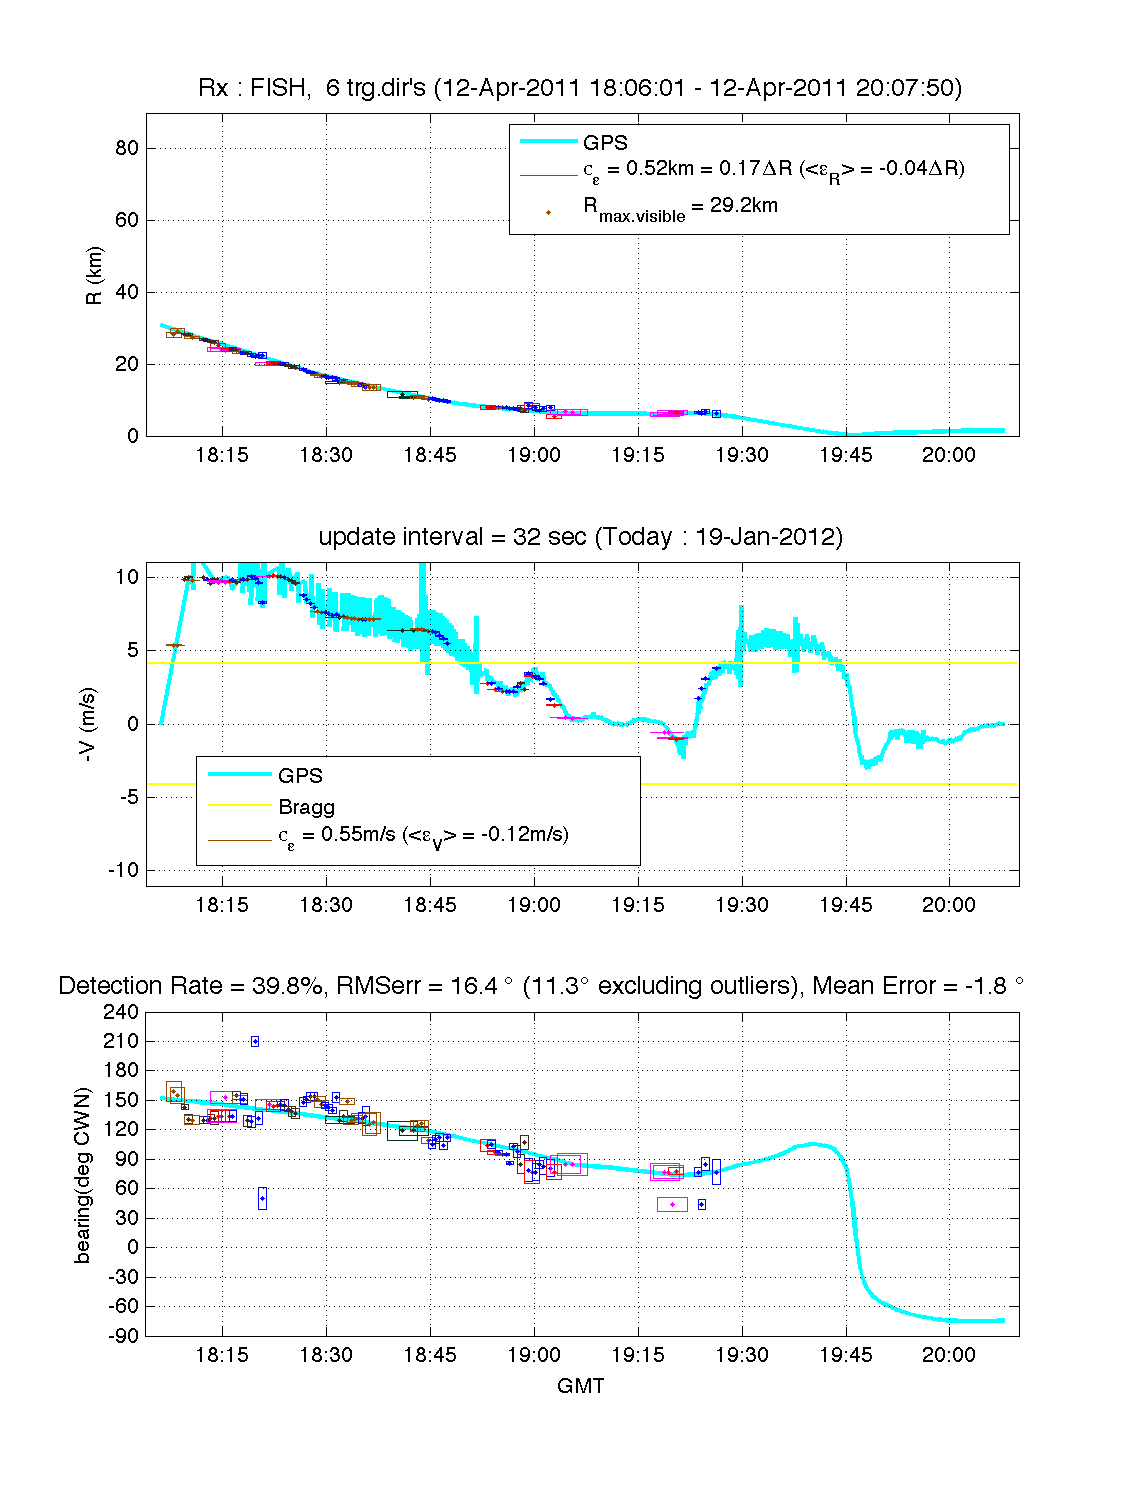
 Maersk Westport
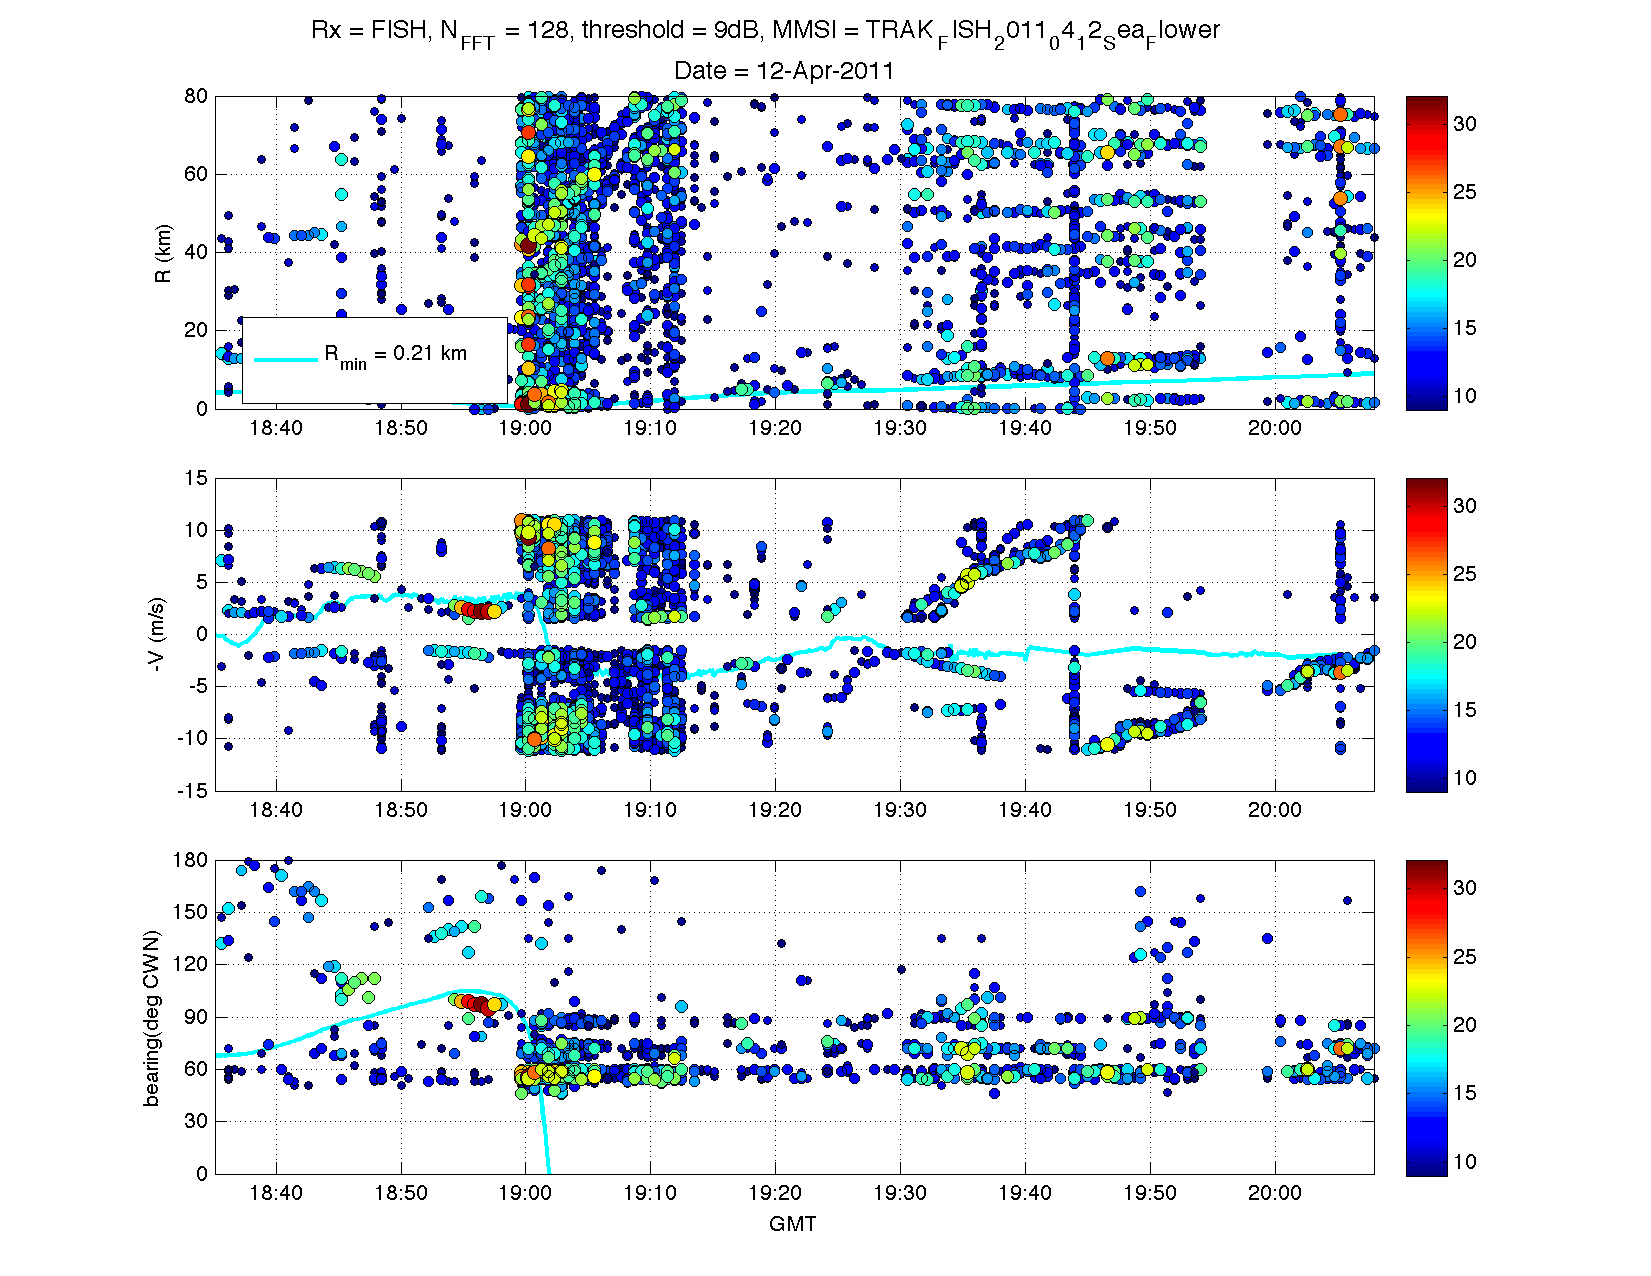
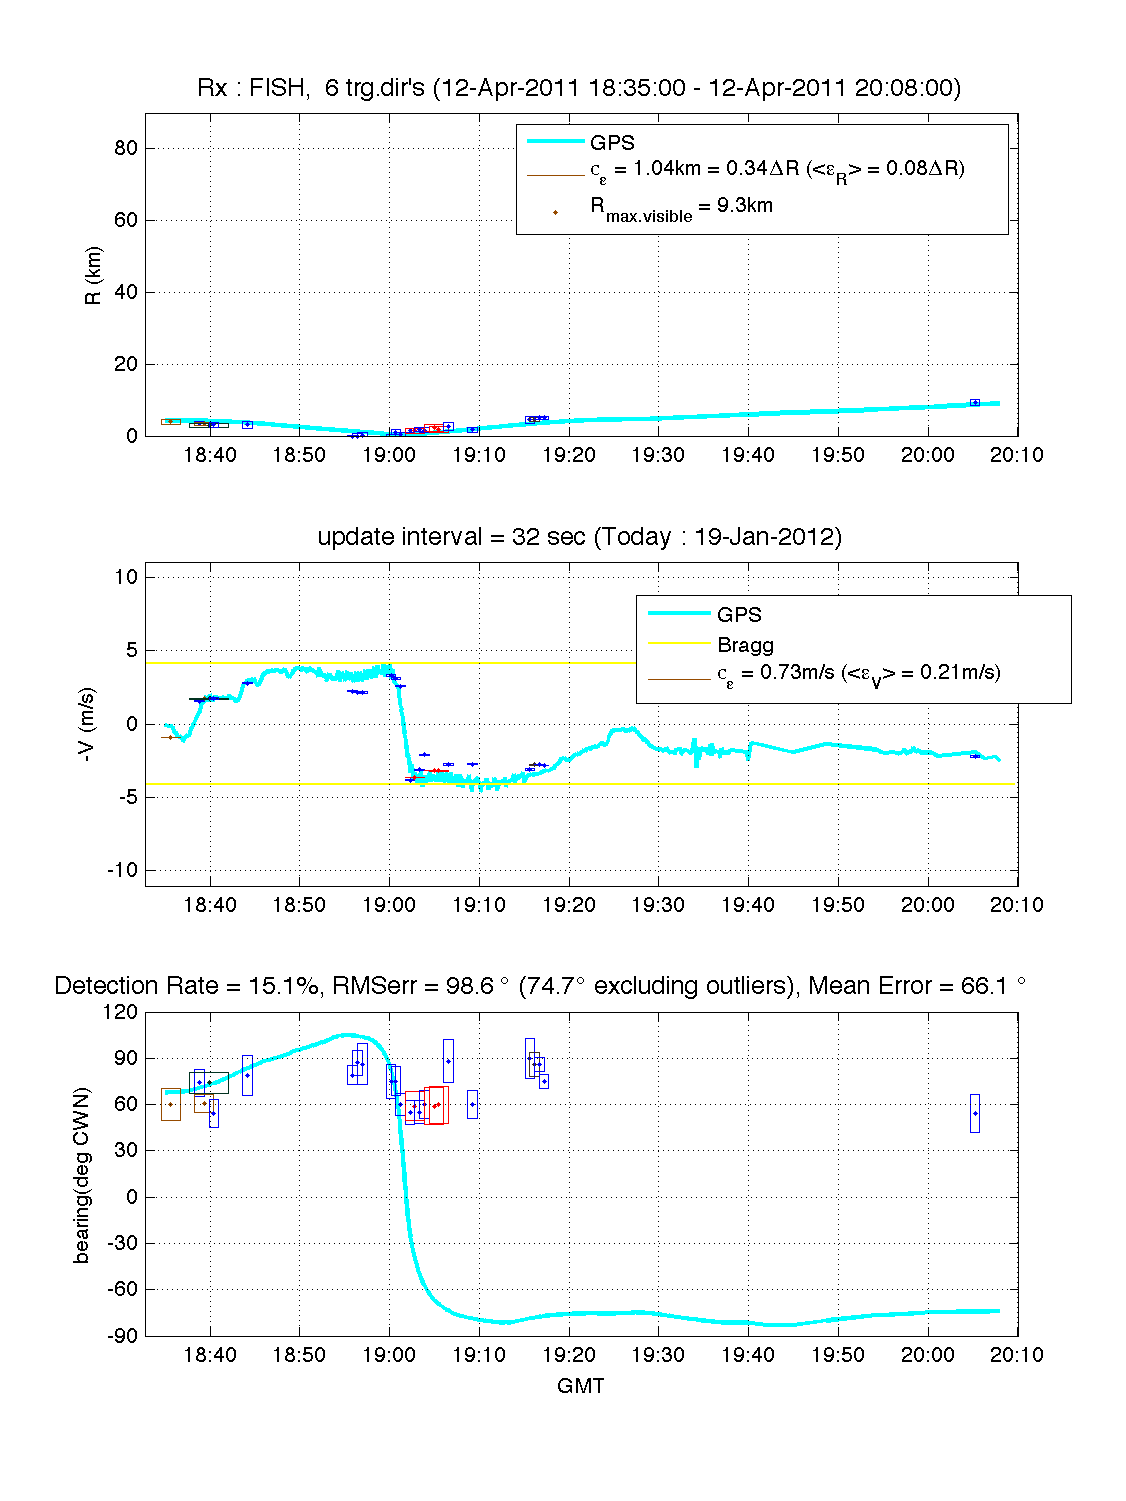
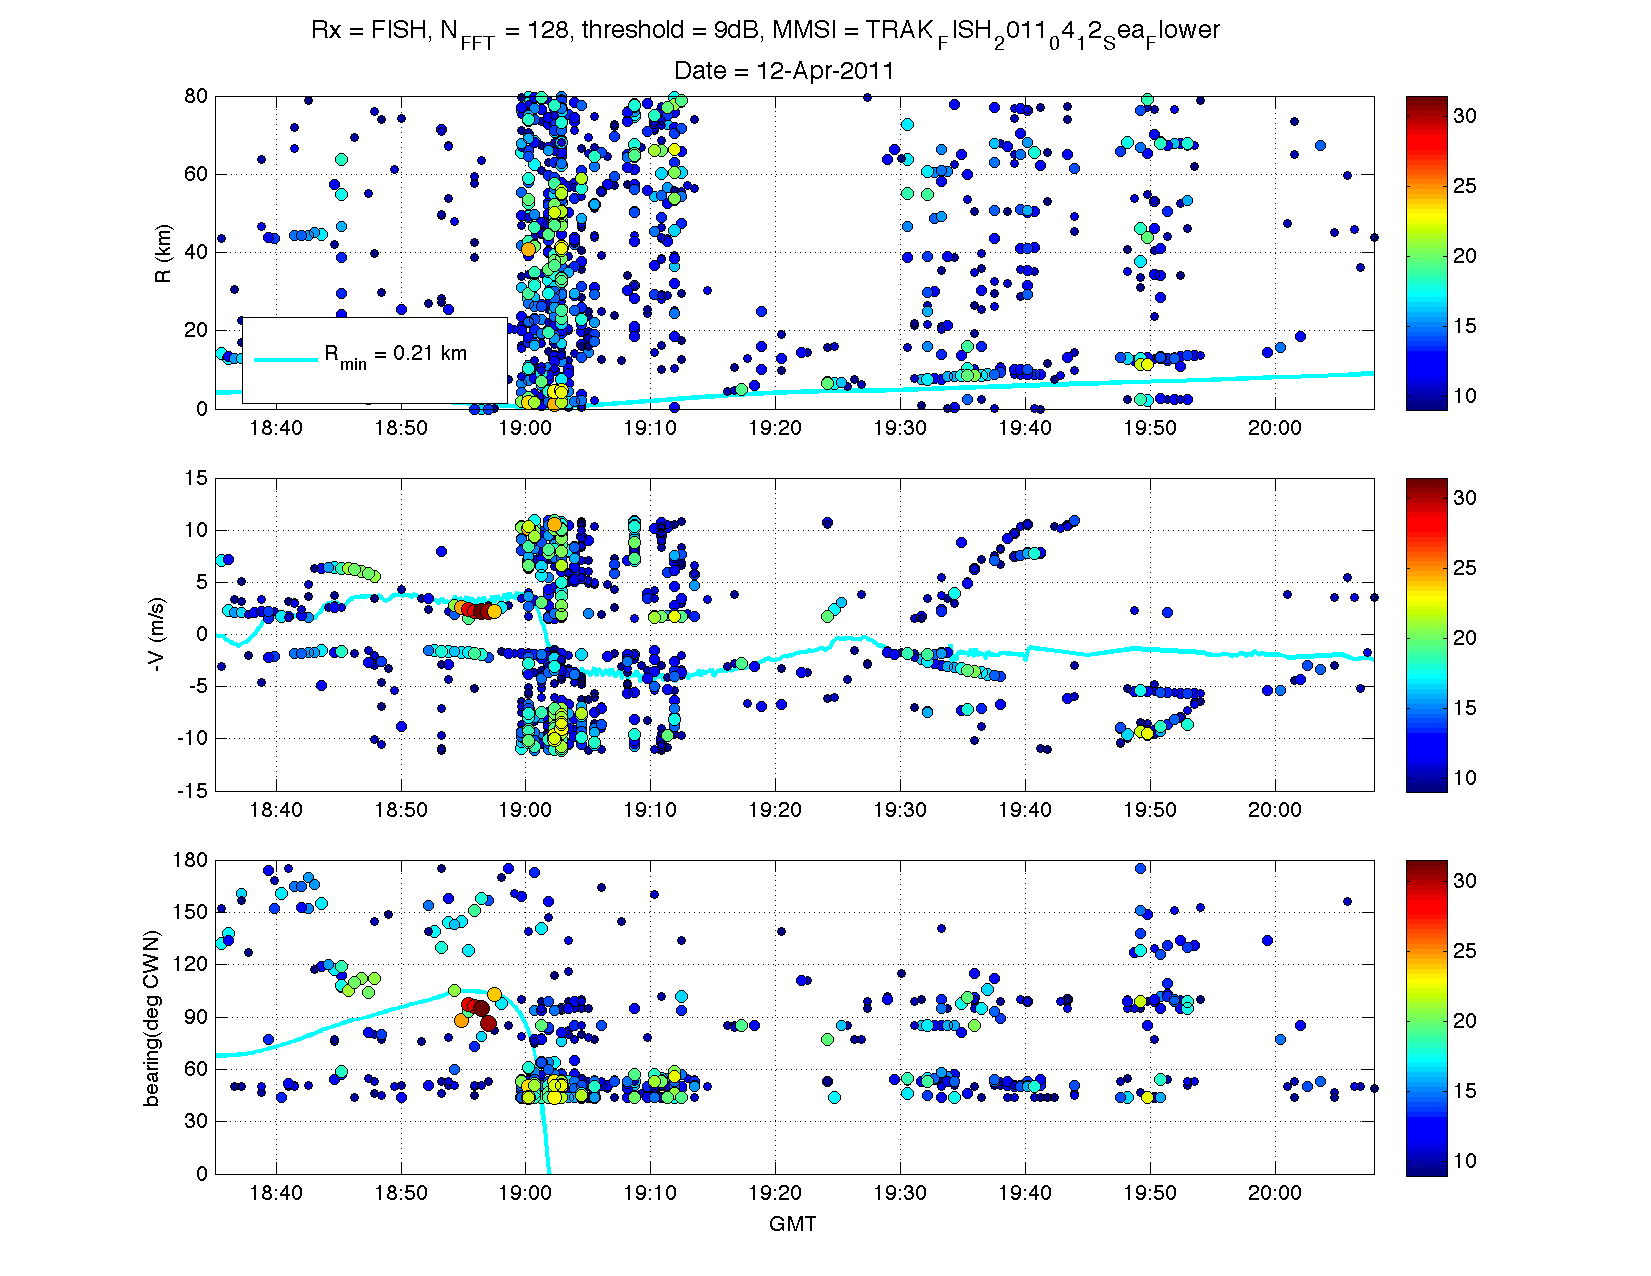
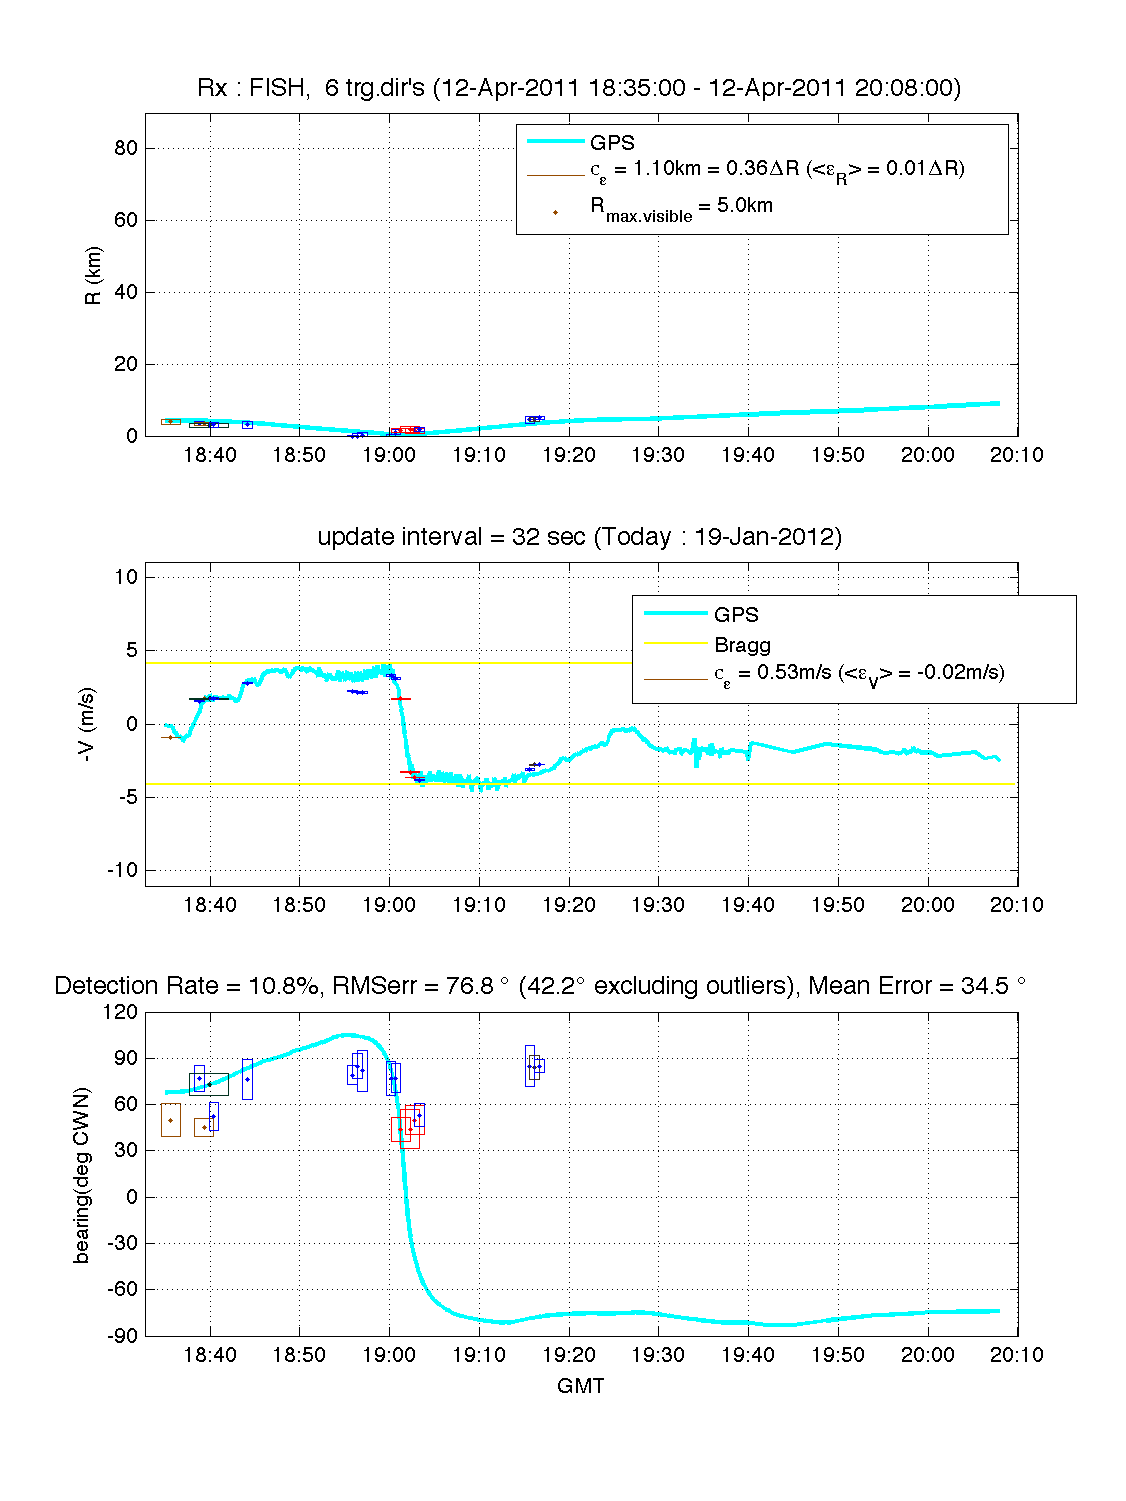
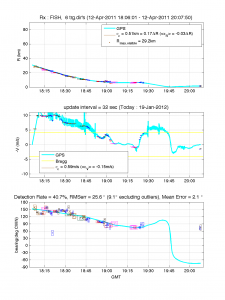 Sea Flower
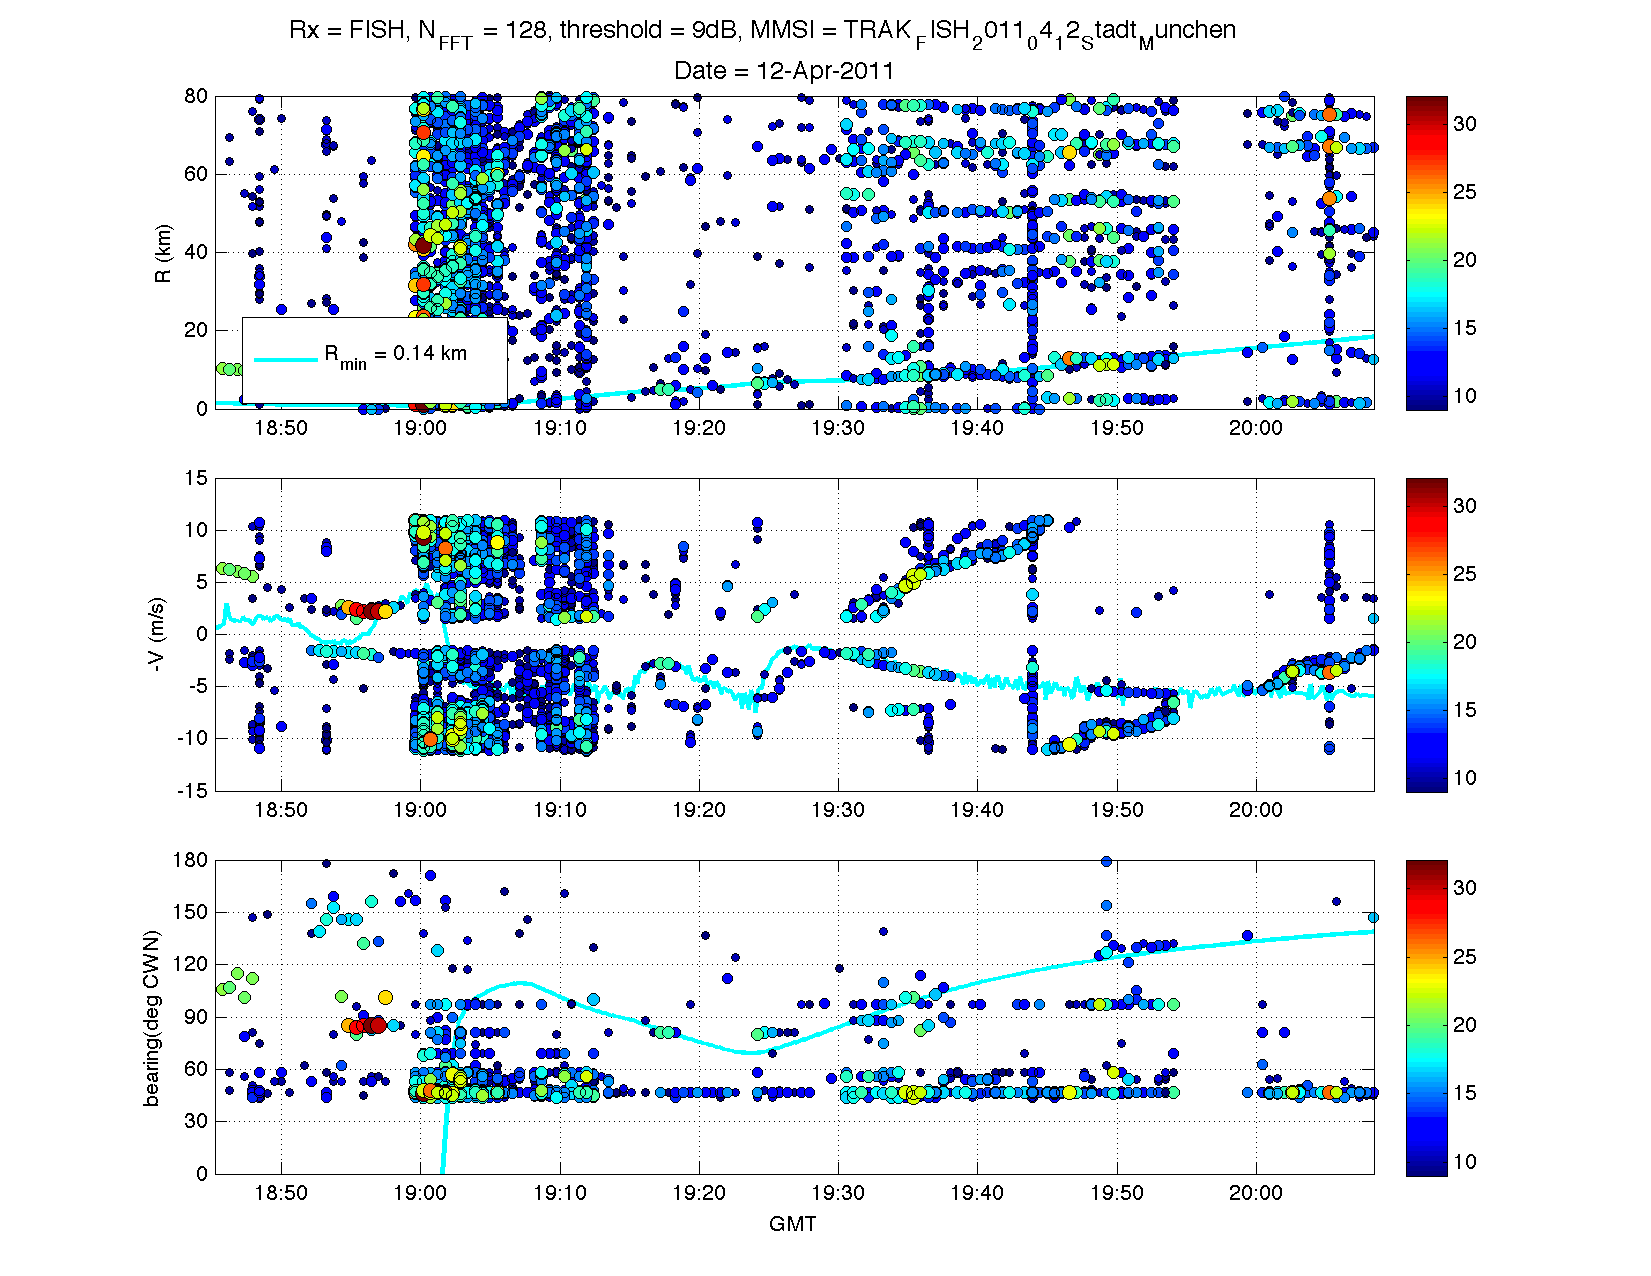
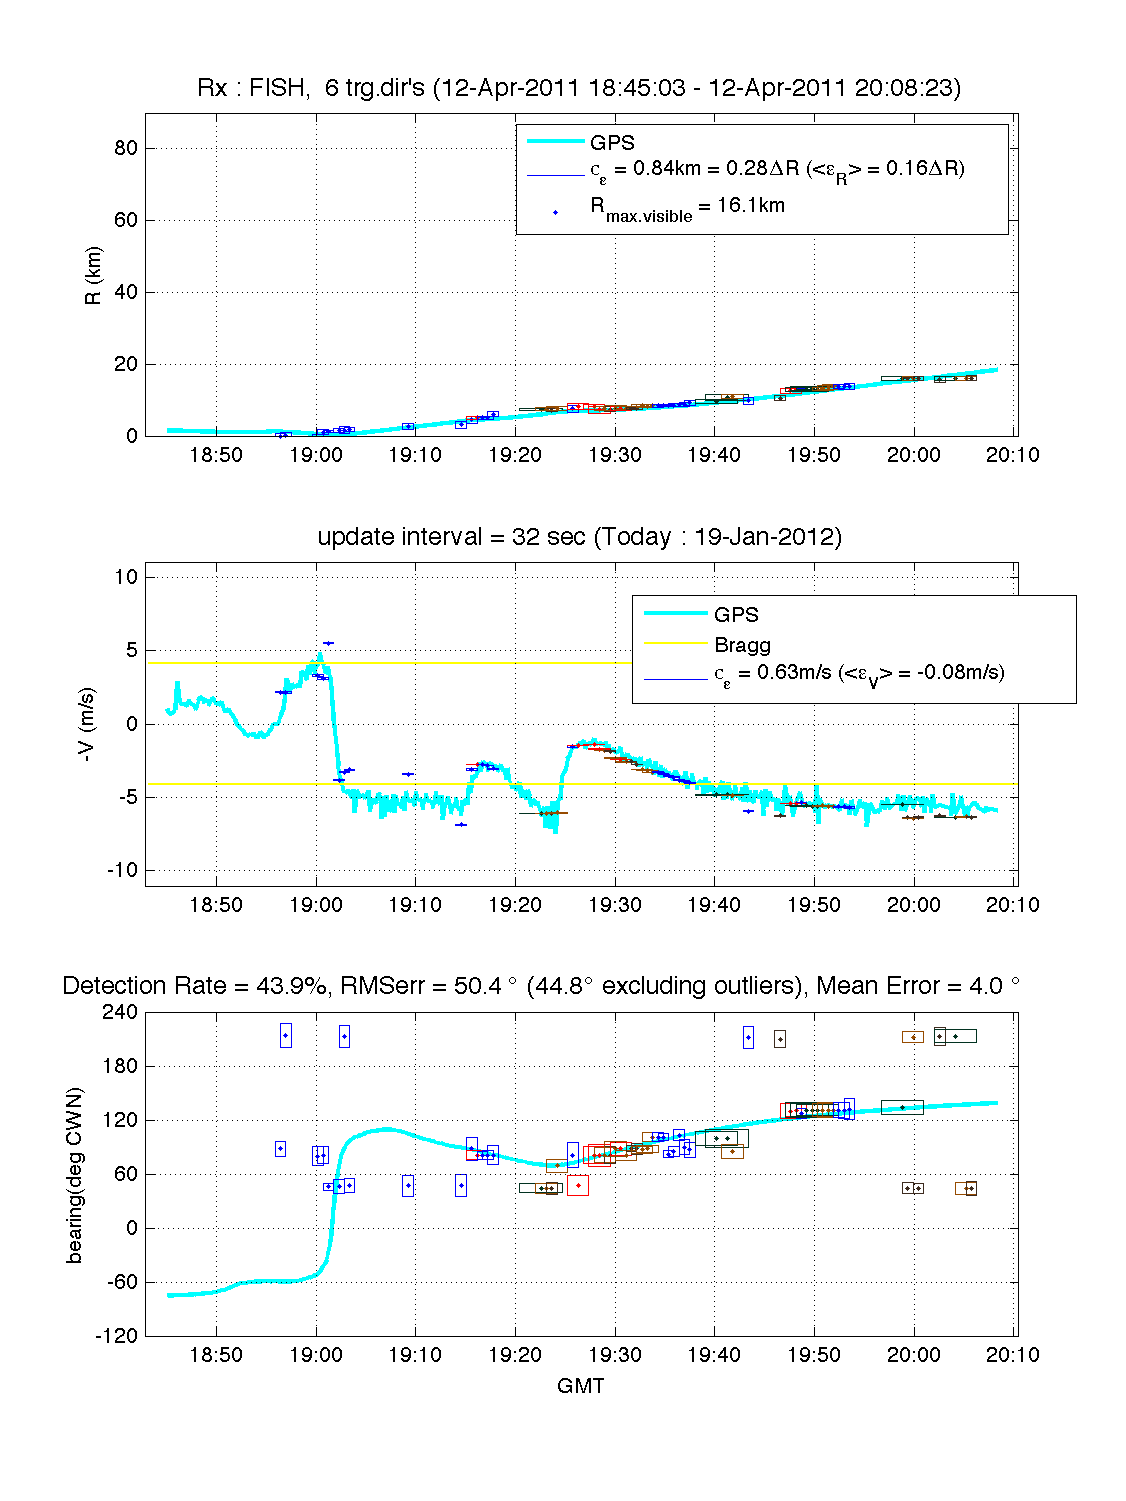
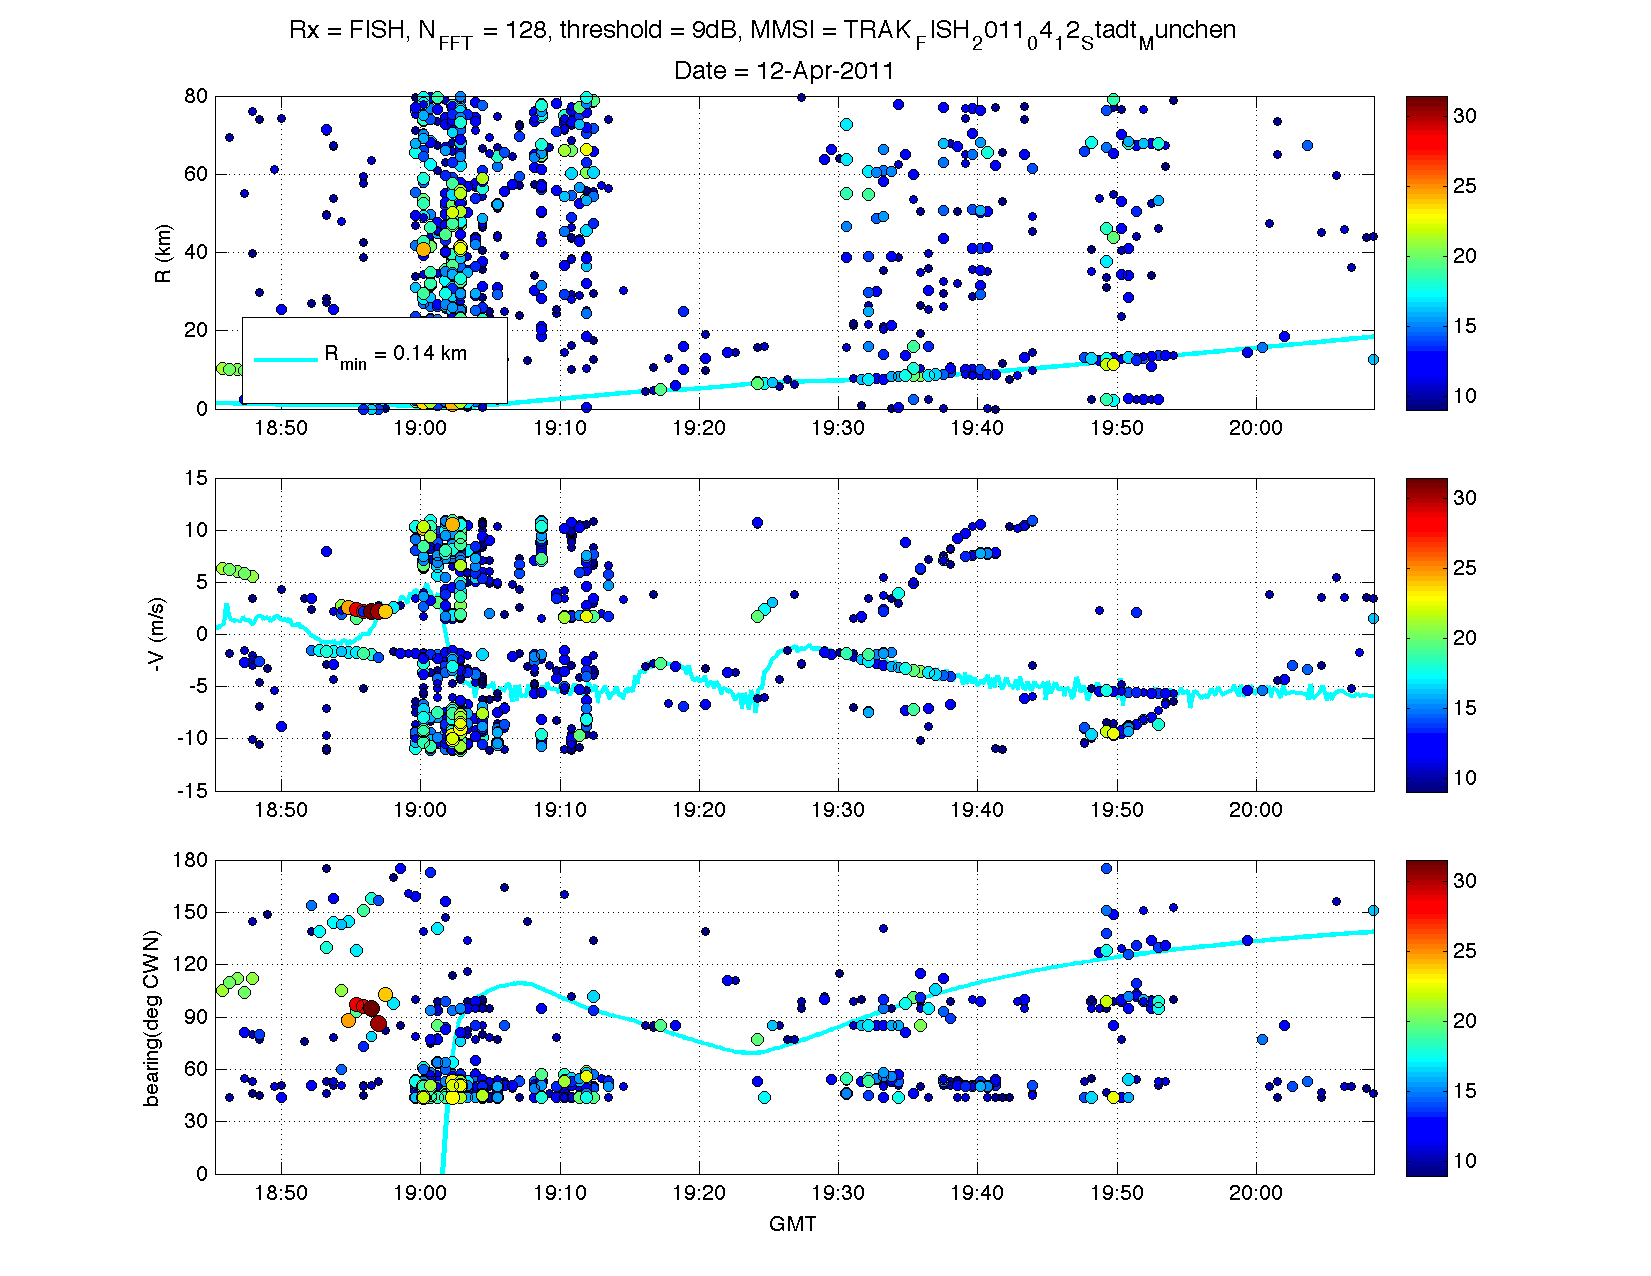
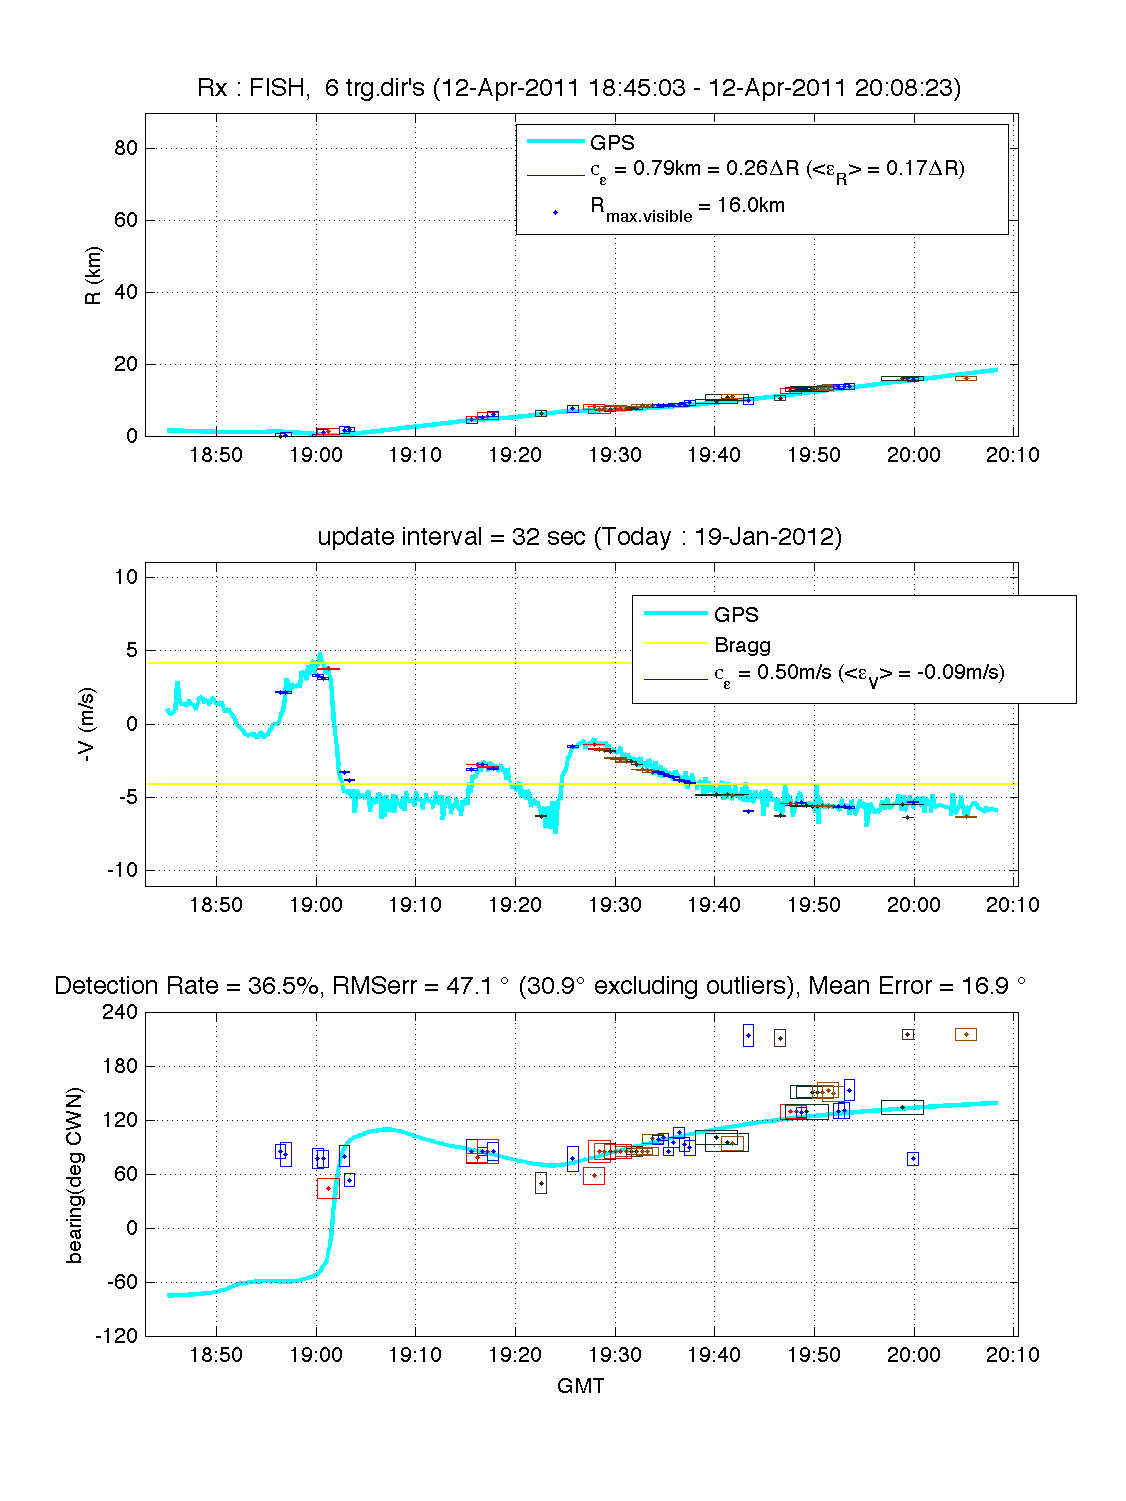
Stadt Munchen
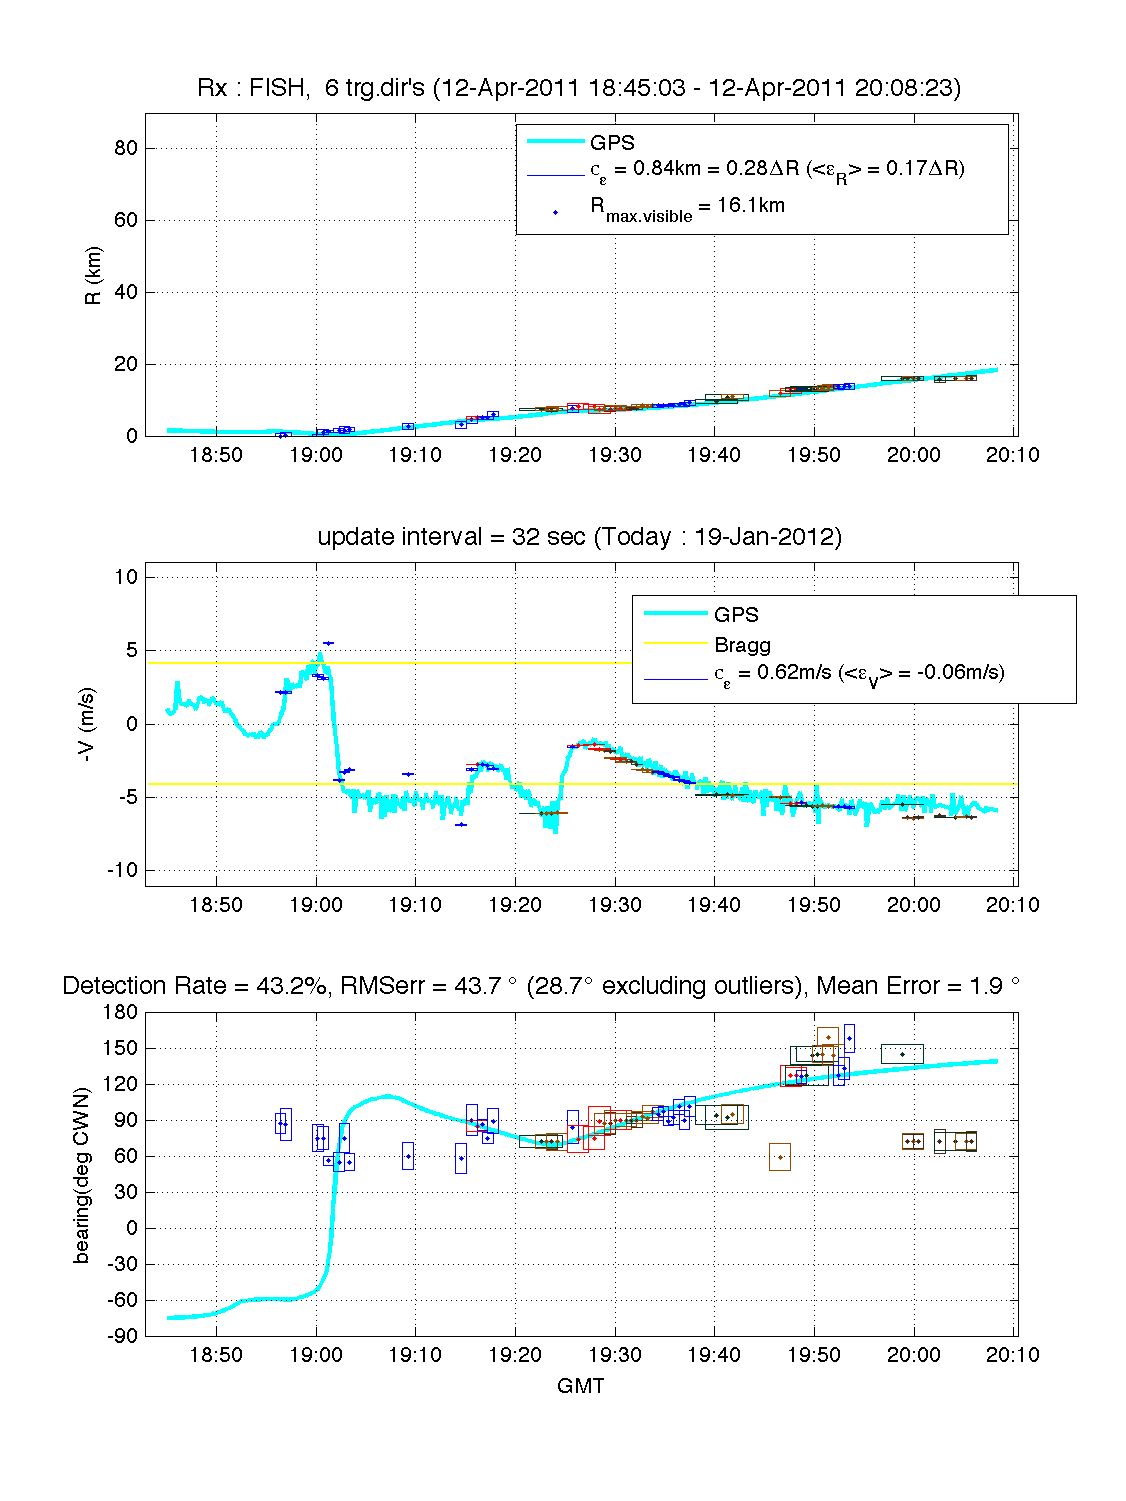
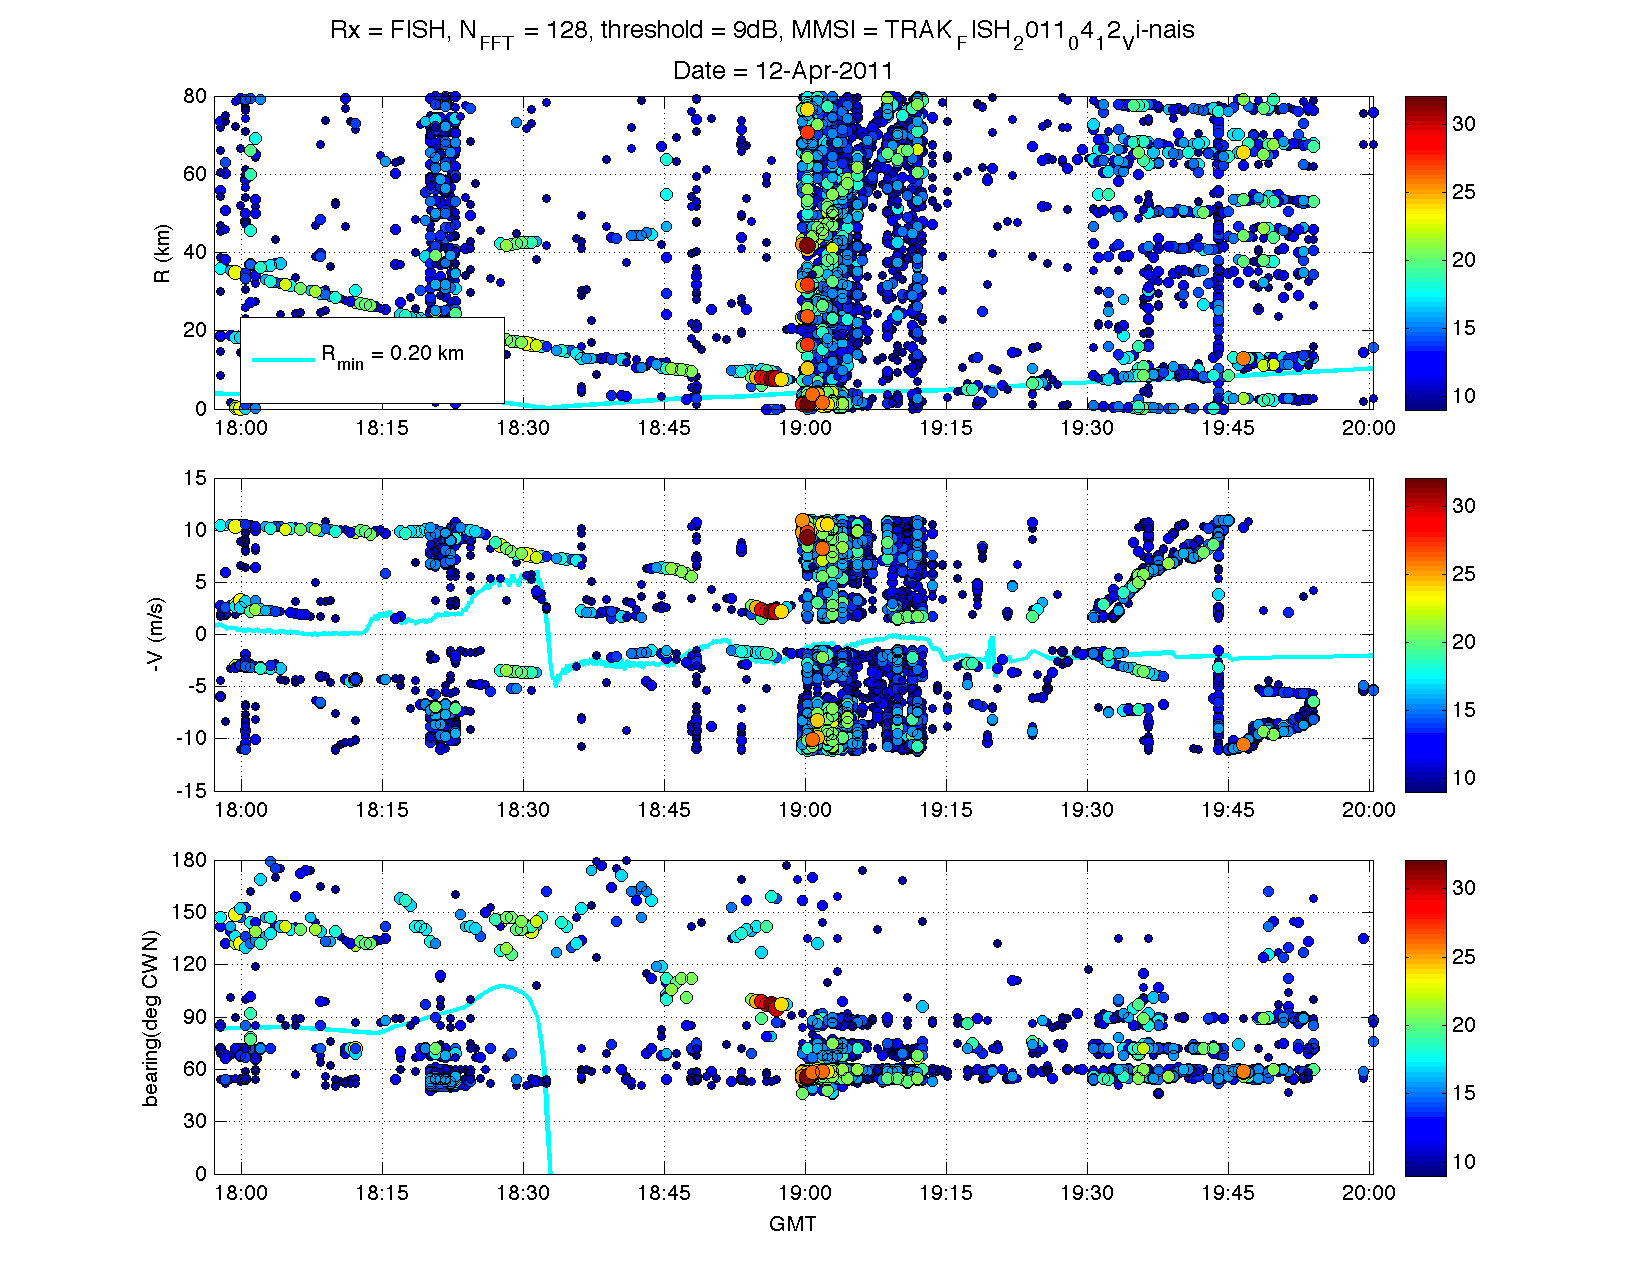
 Vi-nais
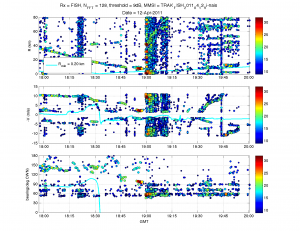
-
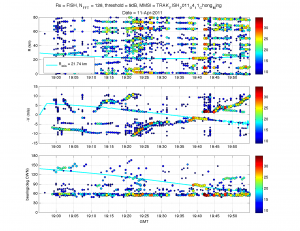
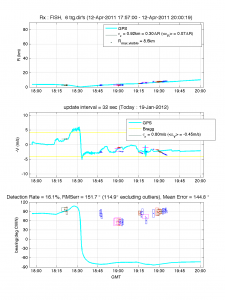
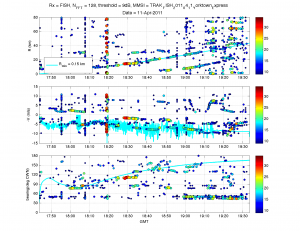
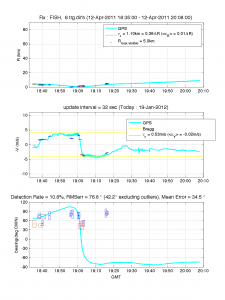
Fisher Island Experiment – 0 degrees smoothing
Posted on January 19th, 2012 No commentsChong Ming
Westerhaven


Yorktown Express

Maersk Westport
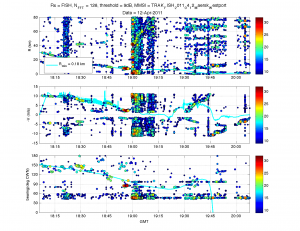

Sea Flower

Stadt Munchen


Vi-nais
-
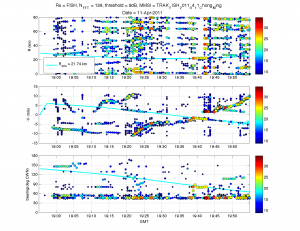
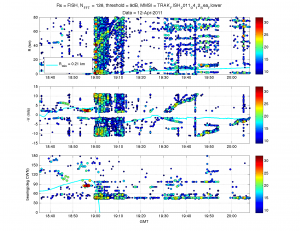
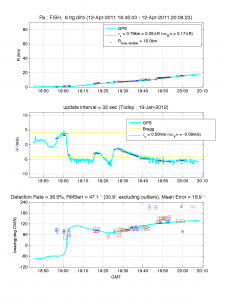
Fisher Island Experiment – 10 degrees smoothing
Posted on January 19th, 2012 No commentsChong Ming

Westerhaven

Yorktown Express

Maersk Westport
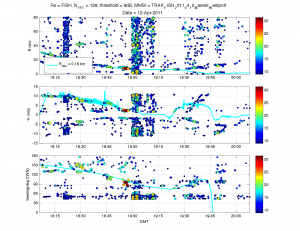
Sea Flower

Stadt Munchen

Vi-nais

-
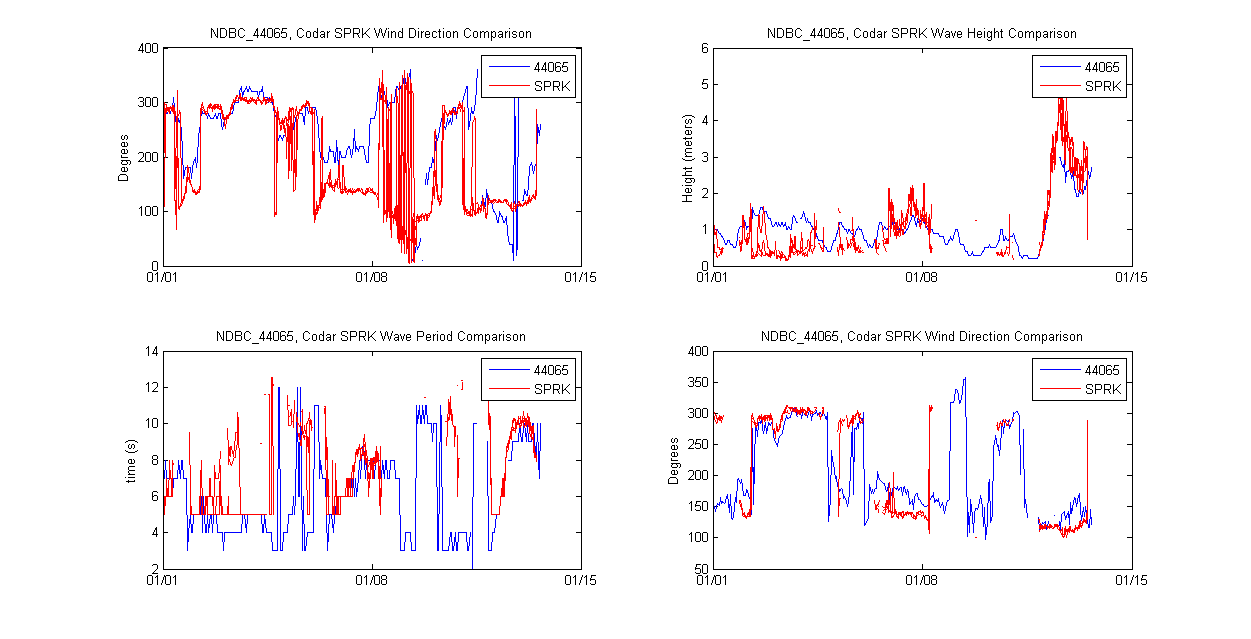
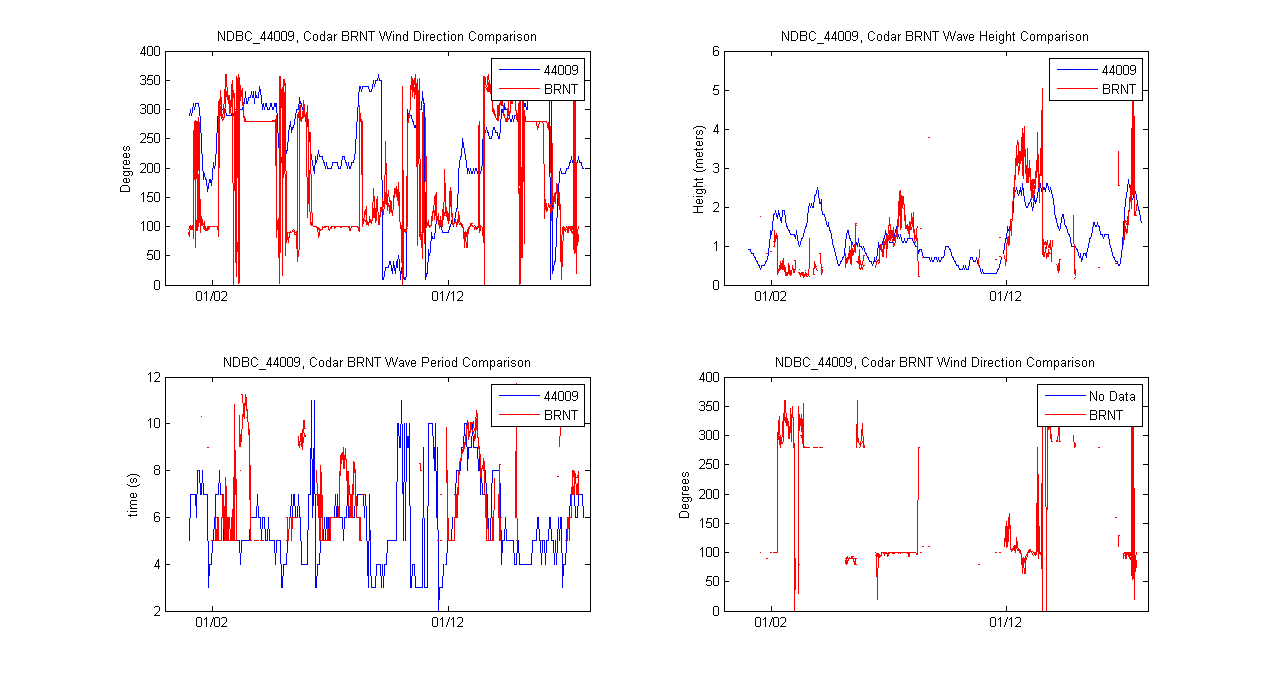
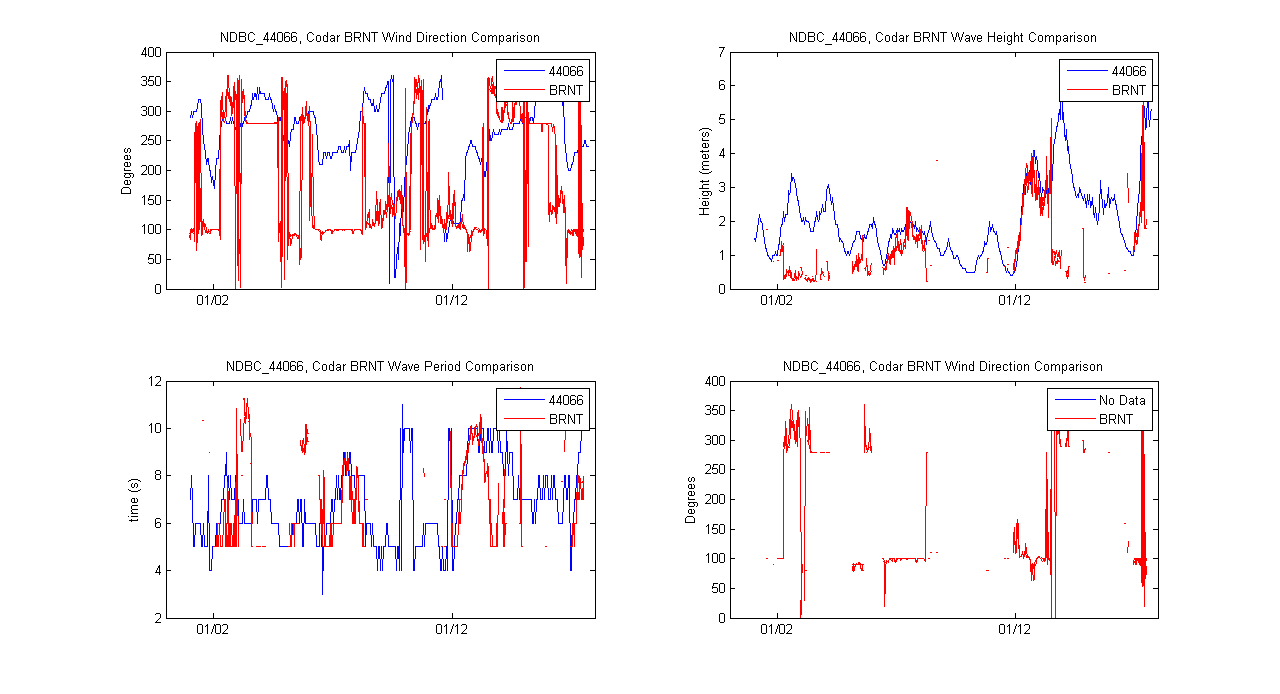
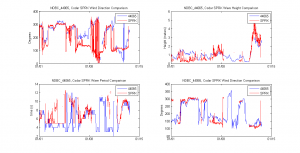
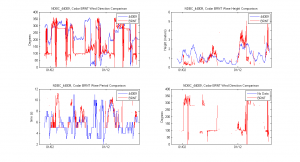
NDBC Buoy-Codar Wind/Wave Comparison Plots
Posted on January 17th, 2012 No commentsBelow are a few subplots displaying real-time wave data taken from 5 13 MHz CODAR sites overlayed with 3 different buoys relative to the site locations. The 5 sites include SEAB, BELM, SPRK, BRNT, and RATH and the buoy locations range from the NY Harbor region to the Delaware bay region.
SEAB-Buoy_44065:
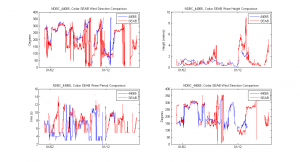
BELM-Buoy_44065:
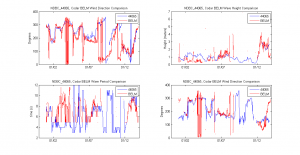
SPRK-Buoy_44065:
BRNT-Buoy_44009:
BRNT-Buoy_44066:
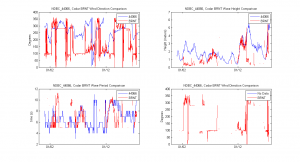
RATH-Buoy_44009:
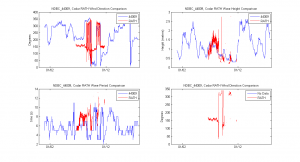
Some of the real-time buoy data taken from the NDBC webpage was missing wave direction values (Seen in the BRNT and RATH plots). For the most part, the data trends are very similar between the 2 systems but there are some spikes in the Codar data, which are evident in the wind direction plots.
-
Gulf of Maine Run
Posted on March 1st, 2011 No commentsWe identified a drifter in the gulf of Maine. It was deployed on April 23, 2010 and lasted till May 24, 2010.
The radial data coverage from the three sites in the Gulf of Maine correspond with the drifter deployment time.
Green Island didn’t come online till May 12. Grand Manan and Cape St Mary were running the whole time.

The sites are the red squares in the image. The sites from left to right are GRNI, GMNB, CSTM. The drifter started in front of the GMNB site and moved offshore so it wont hurt us that GRNI didnt come online till May.
-
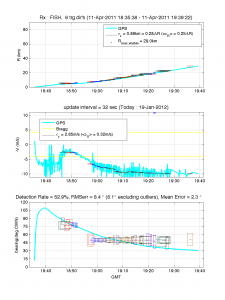
Velocity Plots from the boat experiments
Posted on July 19th, 2010 No comments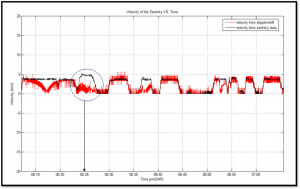
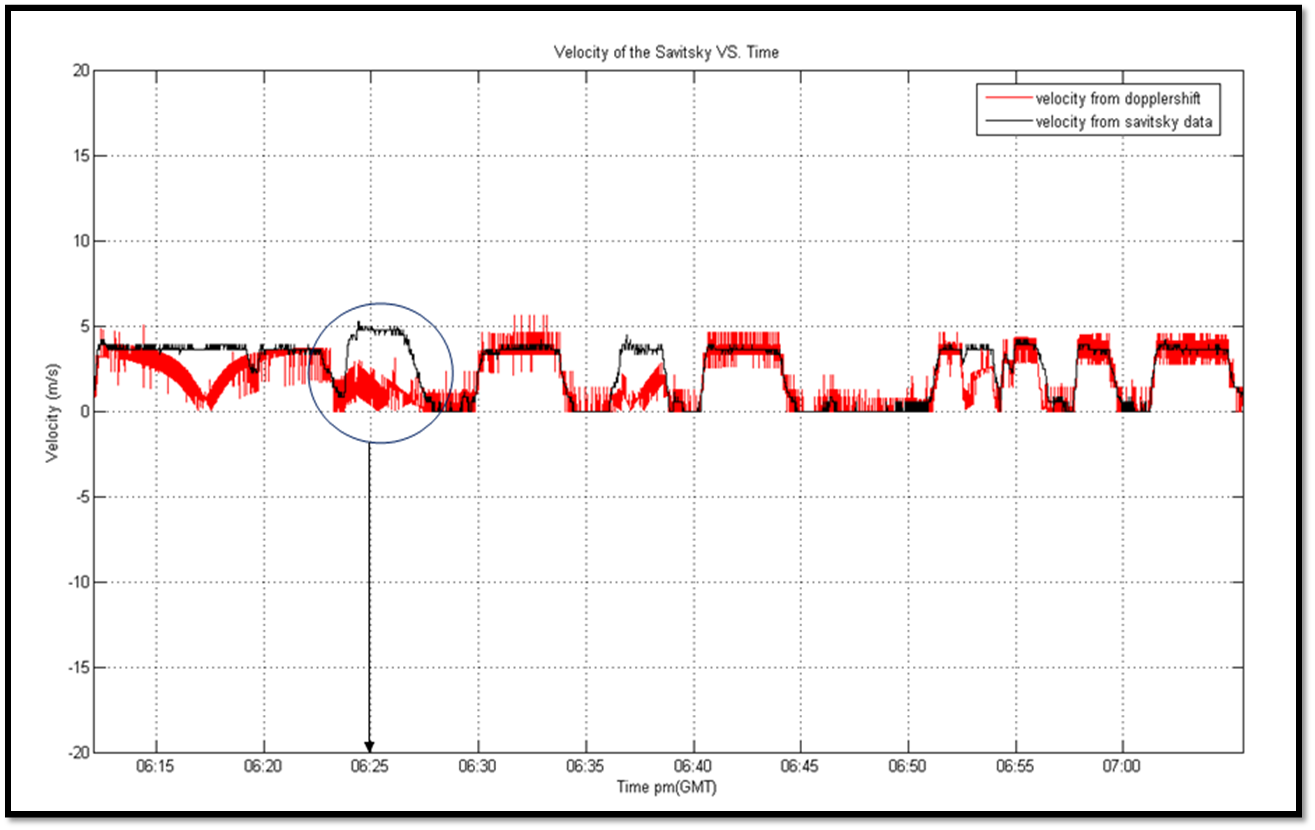
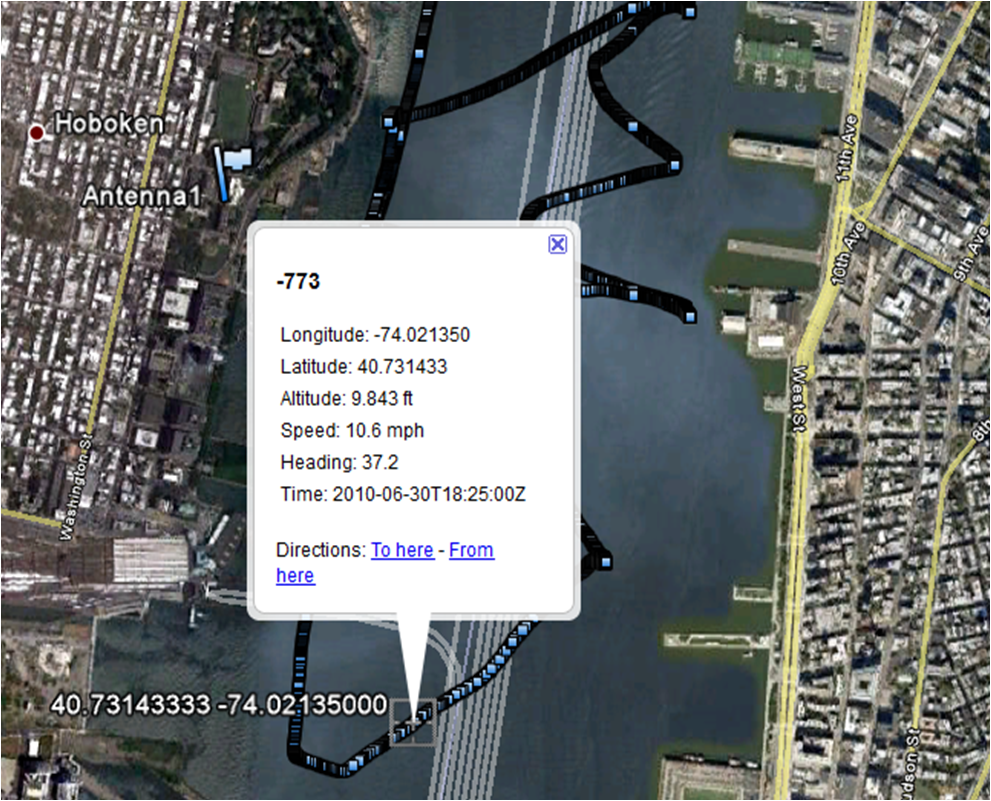
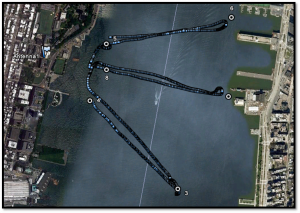
This is the Velocity VS. Time plot from June 30, 2010 at 2pm in which the velocity of the Savitsky does not match with the radial velocity along the entire time. This is because the boat was not drive towards and away to the antenna all the time. As an example the time of 2:25pm was look in the GPS data to find the corresponding coordinates in the boat path.
Here is shown were was the boat at this time. It clearly seen that it has a component of the velocity vector and because of that, the boat speed is different.
-
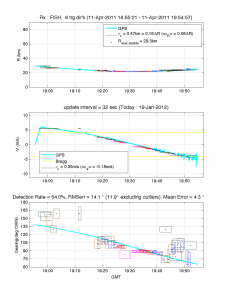
Velocity Plots from the boat experiments
Posted on July 19th, 2010 No comments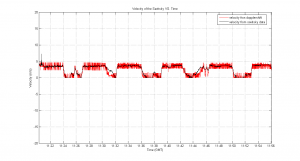
This is the plot of Velocity VS. Time from Savitsky’s GPS boat path on July 13, 2010. The velocity match very well with the radio velocity computed by the MATLAB code using the doppler shift. This is because the boat was moving towards and away from the antenna and the velocity of the boat should be the same of the radial velocity.
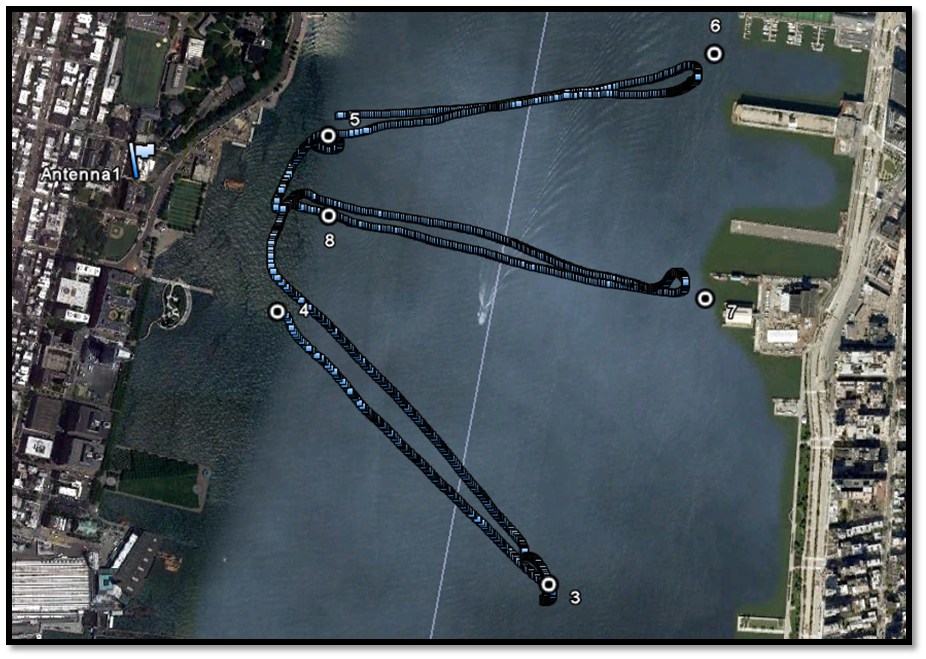
This is the boat path related to this data.
-
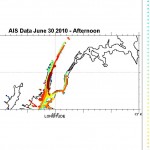
June 30 – AIS data plots
Posted on July 7th, 2010 No comments
Plots from the AIS data gathered during the morning and afternoon experiments on June 30, 2010. The time in the data is not changing, still have to figure out why.
-
-
Data anlysis tasks
Posted on July 1st, 2010 No commentslenny is plotting the ais data
omar is looking at the ship track in google earth
rest of group is correlating strong signals in the spectra to boat traffic
-
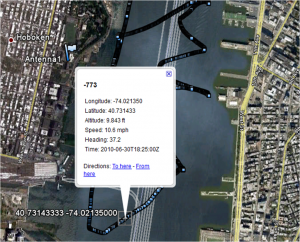
AIS data from June 30 Morning Exercise
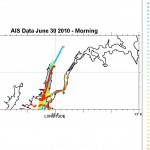
Posted on July 1st, 2010 No commentsHere is a plot of the AIS data from the morning of the exercise. This gives you an estimate of the range of AIS data we are capable of receiving with the AIS receiver on the 6th floor of the Babbio building.

Here is a zoom of the harbor highlighting the location of the RiverSonde as the * Each color represents a different vessel