


Follow Along: Student Activity Idea
 Scientists at Rutgers University Coastal Ocean Observation Lab (RU COOL) are always up for a challenge, and a few years ago when the Assistant Administrator of NOAA gave them a mission to accomplish "for the good of their country," they readily took the bait. That mission: fly an underwater robot across the Atlantic Ocean.
Rutgers University now maintains a fleet of about 20 gliders, small torpedo shaped robots with wings, measuring about 5 feet in length. Gliders propel themselves by changing their buoyancy, which causes them to float and sink through the top 300 feet of the ocean. Their wings help propel them forward, just like an air glider, and a small rudder on the tail fin helps steer them in the right direction. Every few hours, the glider surfaces, sticks it's tail fin above the water, and makes a satellite phone call back to the COOLroom in New Jersey. During the call, the glider can receive new instructions from mission controllers, or if it doesn't get any new directions, it will continue on its existing mission. It then transmits its recently collected instrument data back to the lab, where computer scripts process the data and make it available to the world.
Over the last 5 years, engineers at Rutgers have flown over 130 glider missions. But past missions have traditionally been in coastal areas lasting around 30-40 days. In that time, a glider can travel just under 1,000 km. Making it across the Atlantic Ocean, a distance of over 5,000 km, would require a reengineered glider and a different way of flying.
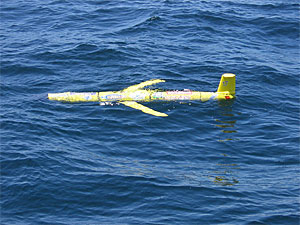
On April 27, 2009, Rutgers students and engineers boarded a boat and traveled out along the coast of New Jersey to deploy RU27, also known as the Scarlet Knight (as Rutgers' mascot is known). RU27 is longer than the other gliders, has been stripped of many unnecessary instruments, and is loaded with batteries. Every day, students at Rutgers analyze the ocean currents around the glider to find the best pathway East and send new coordinates for the glider to follow.
The Scarlet Knight is now slowly making its 6-month voyage Across the Atlantic.
A) Real-time Data Project
You can follow along as COOL scientists and students describe the progress of RU27 on their "Across the Pond" blog. In the right-hand column of this page are several links to data sources. Here are some of the more notable ones.- Real-time Track with Sea Surface Temperature and Currents - The images on this page show the current position of the glider and the track it has taken. You can easily see the strong Gulf Stream current (the dark red band of water) that the glider has used to carry it across much of the Western Atlantic. You'll also notice several Gulf Steam meanders and eddies which the pilots have had to steer around. If you catch an eddy or a meander on the right side, it can help propel the glider towards its destination. But if you end up on the wrong side, it will be pushed back towards the U.S. costing the glider time and battery power.
Currents are very important for the glider pilots. Gliders move very slowly, with a top speed of 0.5 knots (0.58 miles/hour). As a result, any currents stronger than that will overpower the glider. Speeds in the Gulf Stream are often around 2-3 knots, so pilots want to spend as much time in the middle of the stream as possible. But they must be careful that they don't let the glider get swept up in eddies that might carry it 2 knots the other way. The bottom plot on this page help the pilots see the current speed of the glider (shown as a blue line in the upper graph) and the maximum speed of the glider (the red dashed line). When the blue line is above the red line the glider is at the mercy of the ocean currents. This is fine, provided the direction of the currents is eastward (shown by the blue sticks in the lower graph, and as the black arrows in the upper two plots). - Google Earth - If you like to use Google Earth, you can use the following Google Earth Files to view the real-time track of the glider. You can also overlay Sea Surface Temperature imagery for the North Atlantic in Google Earth. This is a great way to study the location and eddies of the Gulf Stream.
- Underwater Data -
Finally, if you're curious to know what the data looks like that the glider is recording as it makes its dives, the following PAGE shows colored profile plots of temperature and salinity. Compared to plots of other glider missions, you'll notice that these plots have a lot of white space in them where there is no data. This is because the engineers are minimizing the amount of time the science sensors are on, in order to conserve battery power.
B) Engaging Questions
Here are a few questions students can think about before they start their research.- What is the distance between the U.S. and Europe?
- What previous adventurers crossed the Atlantic? How did they do it? (Columbus and Lindbergh are obvious examples, but there are many others who have canoed, rowed and even swam across.)
- How long does it take a plane or boat to cross the Atlantic?
- How does the density of an object determine whether it will rise or fall in water?
- How can an object change its density?
- What is the Gulf Stream? What is the North Atlantic Drift?
- How does a glider (air or underwater) move?
C) Suggested Research Questions
Here are several questions students can try to answer by looking at the data.- Assuming there were no ocean currents, how long would it take for a glider traveling 0.5 knots to cross the Atlantic?
- Between what latitudes does the Gulf Stream cross the Atlantic?
- About how far across the Atlantic does the core of the Gulf Stream flow?
- How far has the glider traveled? How much farther does it have to go to reach the coast of Europe?
- Based on the current speed of the glider, how long would it take to travel the rest of the way across the Atlantic?
- Do you think the glider will continue to travel at its current speed? Why or why not?
- What is the temperature and salinity of ocean where the glider currently is? Is this warmer/saltier than the ocean near you?
- Is the temperature/salinity of the ocean the same on the ocean's surface as it is 100m (300 feet) down?
- How deep is the ocean where the glider is flying? How does that compare with how deep the glider flies?
D) Relevant References
For more information on this mission, we encourage you to check out the News Articles and TV Interviews that mention the Scarlet Knight's mission.
Of course, when you're looking for background information, Wikipedia is a good place to start. Specifically, Underwater Gliders and The Gulf Stream are good places to start.
I hope you enjoy interacting with the data and following along with the scientists as we embark on this historic journey. Please let us know of any feedback you have concerning this mission, the data sets provided and what your students might be interested in.
To join the Real-Time Data Educators mailing list, go to:
http://bottle.marine.rutgers.edu/mailman/listinfo/rtd_educators

